What Is EBITDA? (And Why Does It Matter?)
It is a standard metric for investors, yet often misunderstood. Here is the simplest explanation of what it actually means for a business—without the jargon.
Published on

If you watch Shark Tank or read financial news, you have likely heard the term EBITDA thrown around like a magic password. Investors ask, "What's your EBITDA?" and founders are expected to know it by heart.
However, unless you have a background in finance, the exact meaning of the term isn't always clear.
Is it profit? Is it revenue? Is it cash in the bank?
The short answer: None of the above.
EBITDA is a way of keeping score that ignores some of the messy realities of life—like taxes and debt. Think of it as a bodybuilder posing on stage. They look impressive (EBITDA), but that score doesn't tell you if they have bad knees or massive credit card debt (Net Income).
Here is the plain-English guide to understanding the most popular metric in finance.
The Acronym Broken Down
EBITDA stands for Earnings Before Interest, Taxes, Depreciation, and Amortization.
That's a mouthful. Let's translate it using a simple analogy: The Uber Driver.
Imagine you drive for Uber. Last year, the app says you made $50,000. That is your "Revenue." But you had to pay for gas and car washes, which cost $10,000.
So, your Operating Cash Flow is $40,000. In the financial world, this $40,000 is basically your EBITDA. It is what you made from the actual job of driving.
But wait—is that $40,000 actually in your pocket? No.
To find your "real" profit, you have to subtract the costs that EBITDA ignores.
The Funnel Visualization
Use this chart to visualize how EBITDA sits in the middle of the profit funnel.
The "ITDA" Deep Dive: What Are We Actually Ignoring?
To truly understand EBITDA, you have to understand the invisible costs it strips away. Here is exactly what they are and why investors insist on ignoring them.
1. Interest (The Cost of Debt)
Think of this as the "rent" you pay on the money you borrowed.
If you bought a house with a mortgage, you pay the bank thousands of dollars a year in interest. If your neighbor bought the identical house with cash, they pay zero interest. Does that mean your neighbor's house is "better" than yours? No. It just means you financed it differently.
In business, Interest is added back so we can judge the company's performance, not its bank loans. This helps compare a company funded by debt against a company funded by investors on an equal playing field.
* Read more: Interest Expense Definition
2. Taxes (The Government's Cut)
This is the bill you pay for the privilege of doing business in a specific place.
Taxes are messy. A company in Texas might pay different rates than a company in California, France, or Ireland. Furthermore, a company that lost money last year might get a "tax break" this year, making their profits look artificially high.
By removing Taxes, we get to see the raw power of the profit engine before the government takes its share.
* Read more: Corporate Tax Rates Explained
3. Depreciation (The "Wear and Tear" Cost)
This is the cost of aging. If you buy a delivery truck for $50,000, it doesn't stay worth $50,000 forever. Every mile you drive, it loses value. Accountants calculate this loss and list it as an expense every year.
The Reality: Like amortization, this is a "non-cash" expense. You aren't writing a check for depreciation every year; the money left your bank account when you first bought the truck.
Why we ignore it: Adding it back shows us the cash flow potential of the business, ignoring the fact that its equipment is getting older.
4. Amortization (The "Ghost" Cost)
This is often the most difficult part of the acronym to digest because it deals with "intangible" assets—things you cannot touch or hold. Because this concept is so abstract, we have provided five different examples below to help illustrate it.
In simple terms: Depreciation is for physical things (like trucks); Amortization is for non-physical things (like patents). It spreads the cost of a large expense over the time you use it.
- Example A: The Franchise Fee.
Imagine you open a fast-food franchise. You pay a one-time fee of $100,000 for the right to use the brand for 10 years. It wouldn't be fair to say you "lost" $100,000 in Year 1. So, accountants amortize it, recording a $10,000 "expense" every year for a decade. - Example B: The Music Catalog.
When a record label buys the rights to a pop star's songs for $10 Million, they own an asset that will generate money for decades. Instead of counting a $10M loss today, they amortize the cost over 20 years, recording a smaller expense annually. - Example C: The Pharmaceutical Patent.
A drug company spends millions buying a patent for a new medicine. The patent protects them for 15 years. They spread that initial cost over those 15 years on their tax returns. - Example D: The Athlete's Signing Bonus.
A football team pays a star Quarterback a $20 Million signing bonus upfront for a 5-year contract. The cash leaves the bank immediately, but for accounting purposes, the team amortizes the bonus, recording it as a $4 Million expense each year of the contract. - Example E: The Software Overhaul.
A logistics company pays a developer $500,000 to build a custom internal tracking system. Since this software will be used for the next 5 years, they don't expense it all at once. They amortize it at $100,000 per year.
💡 The Insider Trick: Moving the Goalposts to Amortization
Because amortization is added back to EBITDA, it creates a massive accounting loophole particularly common in the tech sector. If a company pays software engineers to maintain their daily code, that payroll is an Operating Expense (OpEx), which lowers EBITDA.
However, if management argues those same engineers are developing a brand-new platform feature, they can legally "capitalize" those salaries. The payroll is transformed into an intangible asset that gets amortized over 5 years. Because it is now amortization, it gets added back to EBITDA. The company instantly looks more profitable on paper, even though the cash leaving the bank account to pay those engineers remains exactly the same.
Why EBITDA ignores all of this:
In every single example above, the "expense" you see on the yearly profit statement is just a number on a spreadsheet. The actual cash left the bank account years ago (or upfront). Adding these numbers back gives investors a clearer picture of how much cash the business is actually generating today.
* Read more: Amortization vs. Depreciation
Why Do People Use It? (The "Apples to Apples" Argument)
If EBITDA ignores so many real costs, why does Wall Street love it?
Because it allows investors to compare Operating Performance without getting distracted by how a company pays for things.
Imagine two pizza shops, Shop A and Shop B.
- Shop A bought their ovens with cash (no debt).
- Shop B bought their ovens with a credit card (high debt).
Shop B will have lower "Net Income" because they are paying interest to the bank. But does that mean their pizza is worse? No. Does it mean they are worse at running a pizza shop? No.
By looking at EBITDA, an investor can see that both shops are equally good at making and selling pizza. It strips away the financing decisions so you can judge the business model itself.
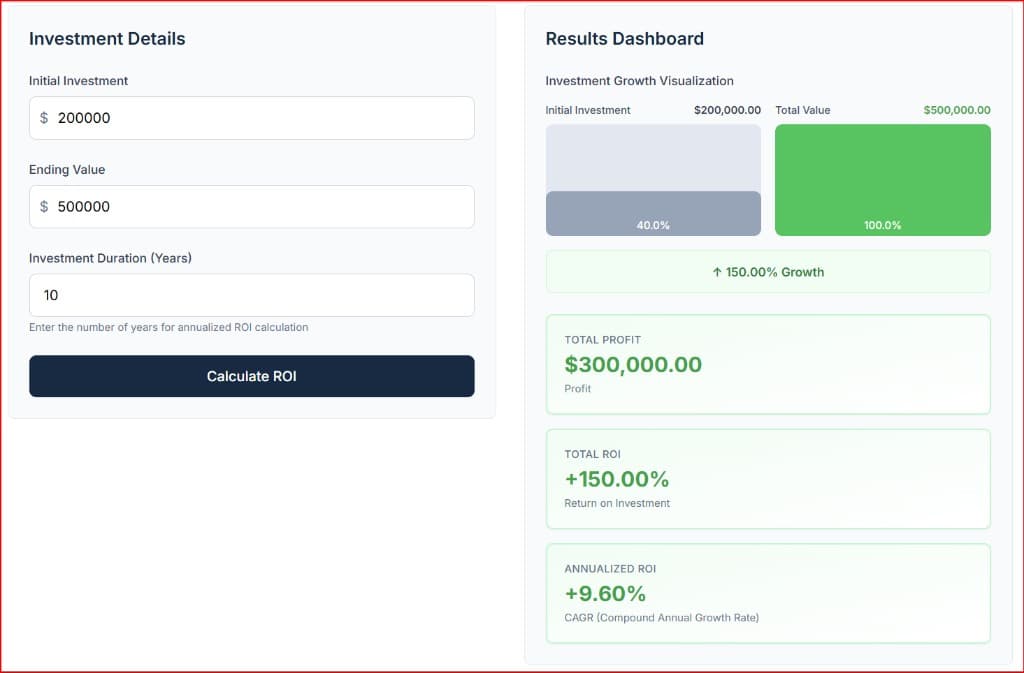
If you are evaluating a business investment, you can use our ROI Calculator to see if the core business returns make sense, regardless of the debt structure.
Swipe horizontally or scroll to the right to view the full screenshot.
The Warning Label: What It Hides
While widely used, EBITDA has significant limitations that smart investors must watch out for.
The biggest issue lies in the "D" for Depreciation.
If you run a delivery company, your trucks will eventually break down. You will have to buy new ones. That is a very real cost of doing business. However, EBITDA treats those trucks as if they last forever.
For companies with heavy physical assets (like airlines, factories, or real estate), EBITDA can be dangerously misleading because it ignores the massive, inevitable cost of replacing equipment.
The Danger Zone
See how two companies can look identical on EBITDA but wildly different in reality.
Is It Right for You?
EBITDA is a tool, not a truth.
- Use it when: You want to compare the operating efficiency of two competitors, or when looking at tech companies that don't have many physical assets (low depreciation).
- Ignore it when: You want to know how much cash a company actually generates to pay its bills.
Just like in personal finance, knowing your "Gross Salary" is fun, but knowing your "Take Home Pay" is what pays the mortgage. (Speaking of which, you can calculate the impact of those "Interest" payments on your own life using our Mortgage Calculator).
| Line item | Conceptual treatment in EBITDA thinking | Why people adjust for it |
|---|---|---|
| Interest expense | Add back (exclude from the operating snapshot) | Financing choices and capital structure—not how the core business ran day to day. |
| Income taxes | Add back (exclude from the operating snapshot) | Tax regime and location mix can swamp comparisons between otherwise similar operators. |
| Depreciation | Add back (exclude from the operating snapshot) | Non-cash accounting for wear on assets; strips a long-lived cost pattern out of a short-window view. |
| Amortization | Add back (exclude from the operating snapshot) | Accounting for non-physical assets (like software or patents) where the cash was already spent upfront years ago. The annual charge is just paper math, not real money leaving the business today. |
| Core operating earnings (revenue minus operating costs) | This is what EBITDA is trying to spotlight | The “before” list above removes layers stacked on top so peers are easier to compare—at the cost of ignoring cash timing and real capital needs. |
Summary: Key Takeaways
- The Definition: EBITDA stands for Earnings Before Interest, Taxes, Depreciation, and Amortization.
- The Purpose: It measures "raw" operating performance, stripping away accounting decisions and financing costs.
- The Deep Dive: It removes Interest (debt costs), Taxes (location costs), Depreciation (wear and tear), and Amortization (non-cash costs) to show pure profit potential.
- The Verdict: Use it to compare businesses, but never confuse it with actual cash profit.
- The Loophole: Watch out for accounting shifts—companies can artificially inflate EBITDA by moving normal operating expenses (like tech salaries) into Amortization profiles.