How Inflation Impacts Your Purchasing Power
Understanding the "Silent Tax" on your wealth.
Published on

Most people notice inflation at the gas pump or the grocery store, but few calculate exactly how much it erodes their long-term wealth. Understanding "Purchasing Power" is not just about rising prices—it is about the mathematical decay of your money's value over time.
What is Purchasing Power?
Purchasing power represents how many goods or services one unit of currency can purchase. As inflation happens, prices increase, and that currency's purchasing power declines. Economists often refer to this as the "Silent Tax" because it reduces your wealth without removing a single dollar from your bank account.
In the United States, this decline is officially tracked by the Bureau of Labor Statistics (BLS). They publish the Consumer Price Index (CPI), which tracks how consumer prices change over time across a basket of goods and services. When the CPI goes up, your purchasing power goes down. While rates fluctuate, even moderate inflation means your money buys significantly less year over year.
The Decay of $100 (At 3% Inflation)
Figure 1: Purchasing power decay assuming constant 3% annual inflation.
Mathematical Verification
To verify these results, we apply the standard formula for future purchasing power: P = C × (1 + r)-n.
At a constant 3% annual inflation rate (r = 0.03):
- After 10 Years: $100 × (1.03)-10 ≈ $74.41
- After 24 Years: $100 × (1.03)-24 ≈ $49.19
This mathematical decay aligns with the Rule of 72, which dictates that at a 3% rate, the value of currency is cut in half approximately every 24 years.
Real vs. Nominal Value
To understand if you are actually getting richer, you must distinguish between "Nominal" numbers (the number on the check) and "Real" numbers (what that check buys). The Fisher Equation defines this relationship: Real Interest Rate equals Nominal Rate minus Inflation Rate (as an approximation).
Impact on Savings
If your high-yield savings account pays 4.0% interest, but inflation is 3.0%, your "Real Return" is only 1.0%. You are barely moving forward. Conversely, if your savings account pays 0.5% and inflation is 3.0%, your real return is negative. You are actively losing wealth by saving money. You can model this using a Compound Interest Calculator to see how different rates impact long-term growth.
Impact on Income
This same logic applies to your salary. If you received a 2% raise this year, but inflation was 2.74%, you effectively took a pay cut. Your paycheck is larger, but it buys fewer goods than it did last year. It is critical to use a Paycheck Calculator to see exactly how much disposable income lands in your account after taxes.
Impact on Investments
Investors often look at "Total Return" (Simple ROI), but this can be misleading over long periods. A stock that doubles in 10 years sounds great, but after adjusting for 10 years of inflation, the "Real ROI" is significantly lower. To get an accurate picture, you should always calculate the Annualized ROI.
Why the "Official" Number Might Be Wrong for You
While the news reports a single "official" inflation percentage, that number is actually a massive average. It includes thousands of items you might not buy every day, like industrial equipment, farm machinery, or new trucks. To find your true "Personal Inflation Rate," you have to look at your "Big Three" expenses: your rent or mortgage, your grocery bill, and your gas tank. If the prices of the things you actually buy are rising by 10%, a 3% national average doesn't accurately describe the math of your life. Understanding that inflation is personal helps you budget for your reality, not the headlines.
Watch Out for "Shrinkflation"
Inflation isn't always a visible price hike on a sticker; sometimes it's a hidden "size cut." You've likely noticed a cereal box or a bag of chips that stays the same price, but the package feels a little lighter or has more air. This is called "Shrinkflation." Companies do this to keep prices looking stable while actually giving you less product for your dollar. Mathematically, it has the same impact on your wealth as a price increase. To spot this, start ignoring the big price on the shelf and look at the tiny "Price per Ounce" or "Price per Unit" listed in the corner of the tag. That is where the real inflation hides.
Same bold price — less in the bag (check price per unit)
Figure 2: Generic illustration only—real labels vary by store and brand. The lesson is identical shelf price with less weight or volume.
The "Mortgage Magic" (The Silver Lining)
Believe it or not, inflation can actually be a "gift" for people with a fixed-rate mortgage. When you lock in a monthly house payment for 30 years, that payment stays exactly the same, but the "value" of those dollars drops over time. As inflation rises and (hopefully) your wages go up to keep pace, that monthly payment takes up a much smaller percentage of your income. You are essentially paying the bank back with "cheaper" money than what you originally borrowed. While the price of eggs goes up, the price of your shelter stays frozen in time, making your home a powerful mathematical shield against rising costs.
Swipe horizontally or scroll to the right to view the full screenshot.
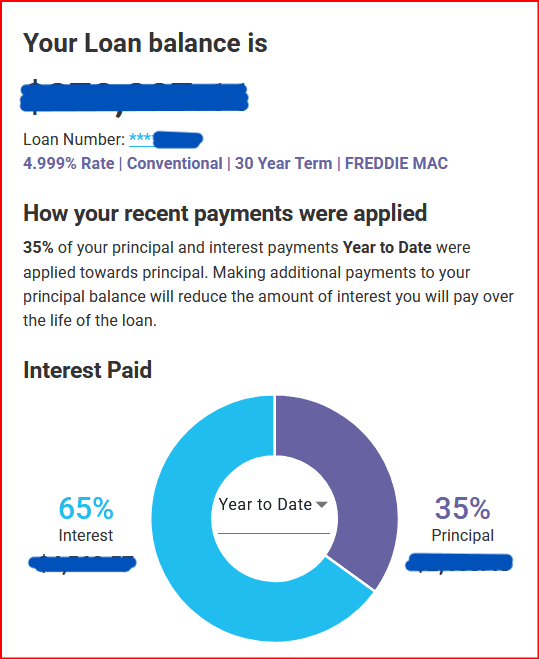
Real-World Evidence: A 30-year fixed-rate mortgage summary. While inflation erodes the purchasing power of the dollar, a fixed-rate payment remains mathematically frozen—effectively allowing the homeowner to pay back the debt with 'cheaper' future currency.
The "Leaky Bucket" Analogy
Think of your savings account like a bucket of water. Inflation is like a tiny, invisible hole in the bottom of that bucket. Even if you aren't spending a single cent, the "water level"—which represents what that money can actually buy—is slowly dropping every day. To keep your bucket from going dry, your money needs to grow through interest or investing at a speed that is faster than the water is leaking out. If your bank pays you 0.5% interest but the "leak" (inflation) is 3%, your bucket is still emptying. This is why keeping "safe" cash in a drawer is often the riskiest place for your long-term wealth.
| Lens | What the number represents | Rule-of-thumb hurt |
|---|---|---|
| Nominal dollars | Face-value prices, wages, and account balances | Can feel fine until you compare what the same paycheck buys at checkout. |
| Real (inflation-adjusted) purchasing power | What your money can command after general price drift | Hurts when raises or returns trail inflation—you are moving forward on paper only. |
| “Headline” raise vs. CPI-type inflation | Simple gap between percent raise and percent price growth | If inflation > raise, you likely took a real pay cut even with a bigger stub. |
| Investment returns | Nominal gain vs. CPI-adjusted gain | A positive nominal return can still be flat or negative in real terms over long horizons. |
Summary
Inflation is a constant economic force. By focusing on Real Returns rather than Nominal Returns, you ensure that your purchasing power grows rather than shrinks.