The High Cost of Waiting: Why You Should Start Investing Yesterday
Mathematical evidence that time in the market can beat timing the market—and is generally simpler to do.
Published on

When it comes to building wealth, many obsess over "picking the right stock" or finding the highest interest rate. While those things matter, they pale in comparison to the one variable you can actually control: Time.
Compound interest is exponential. This means the money you invest in your 20s is worth drastically more than the money you invest in your 40s. Delaying your investment journey by just a few years doesn't just cost you "interest"—it can cost you hundreds of thousands of dollars.
According to Fidelity Investments, the "snowball effect" of compounding creates a mathematical advantage that is almost impossible to replicate with hard work alone.
The Tale of Two Investors
To understand the power of starting early, let's look at a classic hypothetical scenario involving two investors, Early Emily and Late Larry. Both earn an average 8% annual return.
Early Emily (The Sprinter)
- Starts at Age: 25
- Invests: $500/month
- Stops at Age: 35 (She invests for only 10 years, then never adds another penny).
- Total Contributed: $60,000
Late Larry (The Marathon Runner)
- Starts at Age: 35
- Invests: $500/month
- Stops at Age: 65 (He invests for 30 straight years).
- Total Contributed: $180,000
Who has more money at age 65? Many might assume Larry wins because he invested three times as much money ($180k vs. $60k). But the math tells a different story.
Despite investing $120,000 less, Emily ends up with $255,000 more simply because she started 10 years earlier.
The Result? At age 65, Emily wins. Her initial $60,000 grew to $1,000,328. Larry, despite working hard and investing for 30 years, ends up with $745,180.
Wait, how did we get $1,000,328? (The Math)
The calculation happens in two phases. We use the standard Future Value (FV) formula.
Phase 1: Contribution (Age 25-35)
- Principal = $500/mo, Rate = 8%, Time = 10 years
- Result = $91,473 (Accumulated value)
Phase 2: Growth Only (Age 35-65)
- Principal = $91,473, Rate = 8%, Time = 30 years
- Equation: 91,473 × (1 + 0.08/12)360
- Final Result = $1,000,328
Note: Emily's money had 30 years to sit and multiply purely on interest, without her lifting a finger.
The "Wait-and-See" Trap: Why Waiting for a Crash Backfires
A very common thought is: "The market is at an all-time high. I'll wait for a 20% pull-back, then start." It sounds smart, calm, and disciplined.
The problem is timing and lost years. If that pull-back does not show up until 5 years from now, you gave up 5 full years of compounding, dividend reinvestment, and automatic contributions. Even if you nail the bottom later, you are often starting from behind.
In plain English: the money you "save" from buying at a lower price can be smaller than the growth you missed while waiting on the sidelines. Starting now and riding through normal ups and downs is usually the more reliable path.
The "Million Dollar Penalty"
Let's look at this another way. Suppose your goal is to retire with exactly $1 million at age 65. How much do you need to save per month depending on when you start?
- Start at 25: You need to save $286/month.
- Start at 35: You need to save $671/month.
- Start at 45: You need to save $1,698/month.
- Start at 55: You need to save $5,466/month.
The Finish Line Velocity: Where the Real Money is Made
Emily's story has a shape most people miss: it starts slow, then bends upward like a hockey stick. Early on, progress feels modest. Near the end, it can feel explosive.
In many 40-year journeys, the growth during years 35-40 can be larger than the entire account balance was around year 20. That is why the "cost of waiting" is not just a beginner problem. It is also about missing your biggest acceleration years later in life.
Think of it this way: the final years are where compounding does its loudest work. If you delay, you are not only starting late - you are reducing access to the exact years that usually create the biggest jumps.
Illustrative curve only—not Emily’s exact numbers. The point is shape: late-stage growth can dwarf what looked like a “big” balance halfway through.
The Math: Calculating the $286/month
To find the monthly requirement, we rearrange the compound interest formula to solve for PMT (Payment).
- Target (FV) = $1,000,000
- Rate (r) = 8% annual
- Time (t) = 40 years (Age 25 to 65)
- The PMT Formula: PMT = FV / [((1 + r/12)(t*12) - 1) / (r/12)]
- Calculation: 1,000,000 / 3,491
- Result = $286.44
Note: Notice that if you reduce 't' (Time) by just 10 years, the divisor shrinks drastically, forcing the PMT (your payment) to skyrocket.
Waiting 10 years (from 25 to 35) more than doubles the required monthly effort. Waiting 20 years multiplies it by six. As Vanguard explains, "The earlier you begin saving for retirement, the less money it could take."
Common Barrier: "I Don't Have Enough Money"
The biggest myth about investing is that you need thousands of dollars to start. In reality, consistency > intensity. If you can only invest $50 a month right now, do it.
$50/month from age 20 to 65 (at 8%) grows to $262,000.
If you wait until 30 to start, that same $50/month only grows to $114,000.
Swipe horizontally or scroll to the right to see the full-width screenshot.
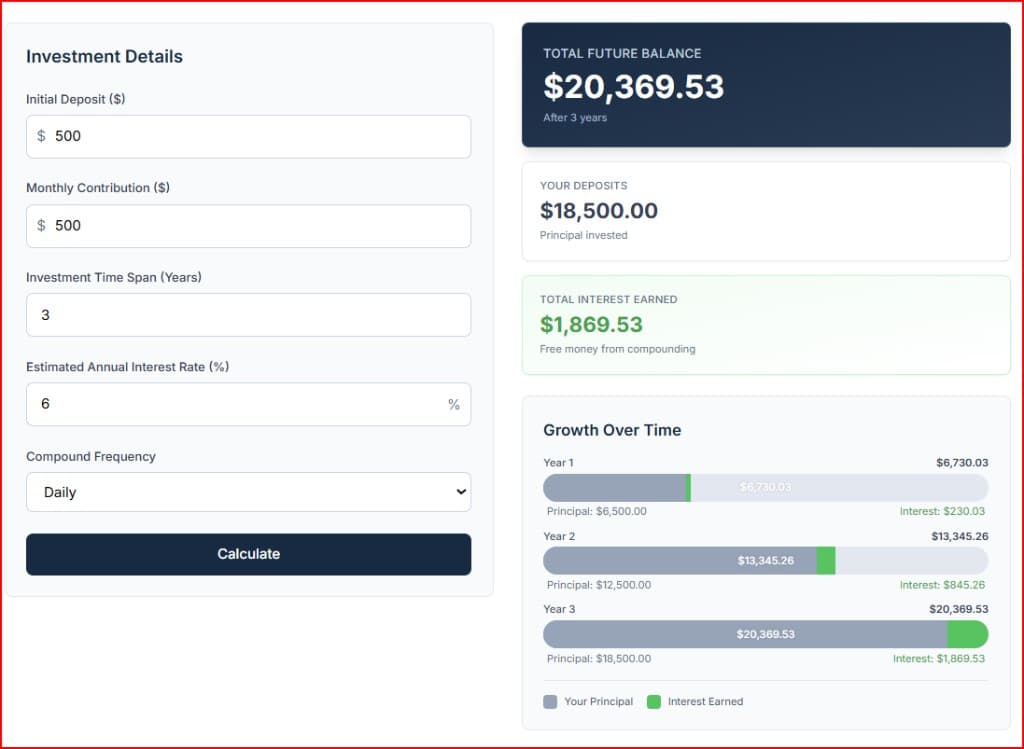
Real-World Audit: A simulation run via our Compound Interest Calculator. With a $500 initial deposit and $500 monthly contributions at a 6% rate, the balance earns nearly $1,900 in interest in just 36 months. This calculation utilizes daily compounding and beginning-of-period deposits—technical standards we employ to ensure our results mirror the high-precision environment of actual brokerage accounts rather than simplified estimates.
The Math: How does $50 become $262,000?
This demonstrates the volume of compound interest over a very long timeline (45 years).
- Monthly Investment: $50
- Total Principal: $50 × 12 mo × 45 yrs = $27,000
- Compound Interest Magic:
- Formula: FV = Monthly Investment × [((1+r)n - 1) / r]
- n (months) = 540
- Total Value = $262,000
Note: You put in $27,000 of your own cash. The market generated $235,000 in investment returns.
That is a $148,000 difference, just for the price of one nice dinner a month.
Disclaimer
All examples presented in this article—including the 'Emily & Larry' story, the 'Million Dollar Penalty' targets, and the $50/month projection—assume a fixed annual return of 8%, compounded monthly, for the entire duration. These figures are hypothetical and intended for educational purposes only.
It is important to note that these calculations represent nominal value (the number on the check) rather than real value (purchasing power). They do not account for:
- Inflation: Which will reduce what this money can buy in the future.
- Taxes and Fees: Which will reduce the net amount you actually keep.
- Market Volatility: The term 'interest' is used here for simplicity; actual market growth comes from 'returns' (dividends and capital appreciation), which vary year-to-year and are not guaranteed.
Please consult with a qualified financial advisor to build a plan tailored to your specific goals and risk tolerance.
Run Your Own Numbers
How much will waiting another year cost you? Use our free Compound Interest Calculator to simulate your own "Emily vs. Larry" scenario. You can compare different starting amounts and see exactly how much your future self will thank you for starting today.
| Typical starting band | Compounding intuition | What waiting tends to cost |
|---|---|---|
| Twenties | The curve is long; small contributions have decades of exponentiation ahead. | Each idle year permanently removes a year from the end of your compounding timeline—sacrificing the year with the most massive exponential growth. |
| Thirties to forties | Still strong, but the same end goal usually demands larger monthly inputs than an earlier peer. | The “catch-up gap” widens: you may need meaningfully higher savings to match someone who started sooner. |
| Fifties and beyond | Time is the scarcest input; market returns have fewer cycles to compound before drawdown. | Waiting forces heroic savings rates or lower goals because there is less runway for volatility to average out. |
Real Talk: Finding the First $100
For most people, the biggest blocker is not math - it is lifestyle creep. Expenses quietly rise to match income, and the investing line item never gets its turn.
Instead of generic "skip your latte" advice, look at the subscribed lifestyle: unused streaming services, a slightly higher car payment than needed, auto-renewed premium tiers, or convenience upgrades that no longer add real joy. That is often where a hidden 10-year delay lives.
The key takeaway is simple and powerful: finding $100/month today is usually mathematically better than finding $300/month ten years from now. Small now beats bigger later when compounding has room to work.
Summary
- Time > Money: A small amount invested early is often worth more than a large amount invested late.
- The "Gap" Widens: The longer you wait, the more you have to contribute monthly to catch up.
- Actionable Step: Don't wait for the "perfect" time or a market crash. The math favors those who are consistent. Check your projection on the calculator and set up an auto-transfer today.