When Your House Sells for More but Your Closing Check Barely Changes
If you're deciding whether to fix up your house before you sell, it's easy to focus on one thing: "How much more could we get on the sale price?" That number can look exciting—but it's not the same as the money you actually walk away with. Things like agent commissions and closing costs often rise when the home sells for more, and repairs plus monthly bills while you work on the house can eat into what's left. This article explains that tradeoff in plain English—no finance degree required—and links to a free calculator so you can plug in your own numbers for your home.
Published on

It is easy to anchor on the biggest number in the room: the offer someone scribbles on a contract, the Zestimate your neighbor mentions, or the list price your agent suggests. That number feels definitive because it is public and simple. What actually hits your bank account after closing is a different creature—smaller, quieter, and built from a stack of subtractions that do not fit on a yard sign.
Rates, transfer taxes, and local customs still vary by market, but the logic is universal: gross sale price is not the same as net proceeds, and net proceeds are not the same as life flexibility after you pay off the lien, move, and restabilize. This piece explains the gap in plain language, gives you a mental model for the closing statement, and points to calculators and guides so you can pressure-test your own scenario before you optimize for the wrong variable.
Gross vs. Net: Why the Number on the Contract Is Not Your Deposit
Think of the sale price like the sticker on a car at a dealership: it is real, it is printed, and it starts the conversation—but it is not what leaves the lot in your checking account after financing, fees, and trade-in equity settle. In a home sale, the analog is the payoff on your mortgage, title and escrow charges, broker commissions, negotiated repairs, tax prorations, and any seller credits to the buyer. Each line is small enough to skim; together they can erase thousands of dollars between the number you talk about at dinner and the number you can actually deploy.
That distinction matters because humans make different decisions when they believe they are "getting" $50,000 more than when they know they are walking away with $18,000 more after everyone else has been paid. If you are comparing offers, deciding whether to renovate, or timing a purchase on the other side, the useful input is almost always the net sheet—not the headline.
How Money Moves at Closing: A Waterfall, Not a Single Faucet
Another analogy that holds up well is a waterfall: money arrives at the top as the buyer's payment (often financed), then cascades through rigid buckets in a fixed order. Lenders and title companies are not being picky for sport—they are satisfying liens, recording interests, and clearing exceptions so the deed is defensible. Until each bucket fills, the stream does not reach you at the bottom. That is why two contracts with the same sale price can produce different wires if one buyer needs more seller concessions or if your payoff figure moved between estimate and funding.
The diagram below is schematic, not a substitute for your ALTA settlement statement, but it shows the idea: gross inflows at the top, mandatory outflows in the middle, and seller net at the bottom. When you model a sale, try to label every band you can predict—even rough ranges—before you compare strategies.
Line Items That Quietly Shrink the Check
Transfer taxes and documentary fees are the classic surprise because they sound bureaucratic until you multiply them by your price point. HOA demand payoffs, overdue assessments, and move-out deposits can appear late in the file. If you agreed to a home warranty for the buyer or prepaid property taxes that get reprorated on a calendar quirk, those are not philosophical—they are arithmetic on page five of a PDF you sign while exhausted.
Seller credits for rate buydowns or closing costs are especially sneaky: they do not always change how "high" the offer looks in casual conversation, but they move dollars straight out of your column. When you compare bids, normalize each offer to an estimated net sheet, not to the top-line number in the email subject.
The Garage-Sale Analogy for Emotional Pricing
At a garage sale, you might tag a lamp at $40 because it feels respectable. If someone offers $35 cash right now, the "higher" story in your head is the tag—not the twenty minutes you would spend haggling, the risk nobody buys it, or the trip to donate it later. Real estate is the same emotional trap at a larger scale: a higher list narrative feels like winning, even when the timeline, concessions, and repair credits mean you would have kept more money with a lower, cleaner offer.
Professional negotiators separate ego metrics from bank metrics. Your ego metric might be "we sold above ask." Your bank metric is "after everything, we had X to roll into the next chapter." There is no moral failure in caring about the second one more—especially if you are simultaneously thinking about how much house you can really afford on the purchase side, where lenders still mostly speak in gross income and payment ratios, not in your personal margin for error.
When the "Bigger" Offer Still Leaves You With Less
Here is a stylized example—rounded, illustrative, not tax or legal advice—showing how Offer A can beat Offer B on the marquee while losing on the wire. The lesson is not that lower offers are always better; it is that you must read the bundle. Financing contingencies, appraisal gaps, and repair caps can all flip the ranking once you model dollars instead of adjectives.
Use the table as a pattern for your own spreadsheet: for each offer, list price, credits, expected repairs, and your best guess at closing costs. If you want a structured way to compare renovating versus selling as-is with holding costs baked in, run the numbers in our Sell House As-Is vs. Fix It Up First Calculator—it is built exactly around headline price versus what is left after time and money leave the picture.
| Item | Offer A (higher price) | Offer B (lower price, cleaner) |
|---|---|---|
| Contract price | $510,000 | $495,000 |
| Seller credits to buyer | $18,000 | $3,000 |
| Agreed repairs / escrow holdback | $12,000 | $2,500 |
| Estimated commissions + title + transfer (illustrative) | $38,000 | $37,000 |
| Approx. net before mortgage payoff | $442,000 | $452,500 |
Repairs, Polish, and Strategy: Headline Price vs. Your True Trade-Off
Renovations can lift appraised value and buyer enthusiasm, but they also consume cash up front, introduce schedule risk, and interact with tax and basis questions in ways a simple ROI meme cannot capture. A thoughtful seller compares three clocks: how long the work takes, how long the house sits on market afterward, and how long you need liquidity for your next step. A higher eventual contract that closes four months later is not automatically superior to a lower one that closes in three weeks—especially if you are paying overlapping housing, storage, or short-term financing.
The calculator linked above forces those clocks into the same worksheet. Pair it with the big-picture question of whether your equity should accelerate debt payoff or stay invested: the Pay Off Mortgage vs. Invest Calculator is not a crystal ball, but it makes the trade-off explicit instead of ideological.
What Happens After the Loan Is Gone
Paying off a mortgage at closing feels like a victory lap—and financially, it often is, because you eliminate a large secured liability in one stroke. It can also feel like a disappearing act: six figures on a closing statement vanish into a satisfied lien, and what remains is the part people forget to budget for. That remaining slice has to cover moving, deposits, maybe bridge rent, and the next down payment if you are buying again. Understanding amortization helps you see how much of your past payments reduced principal versus interest—use our amortization explainer if you want a refresher on how payoffs are calculated from the lender's side.
If you are sizing the next purchase, remember that underwriting affordability and personal affordability diverge. The same tools you used when you bought—payment estimates, HOA, commute—still apply, only now you are holding proceeds instead of equity on paper. Condo vs. single-family buying power is a useful reminder that identical monthly payments can buy very different lifestyles once dues and maintenance enter the chat.
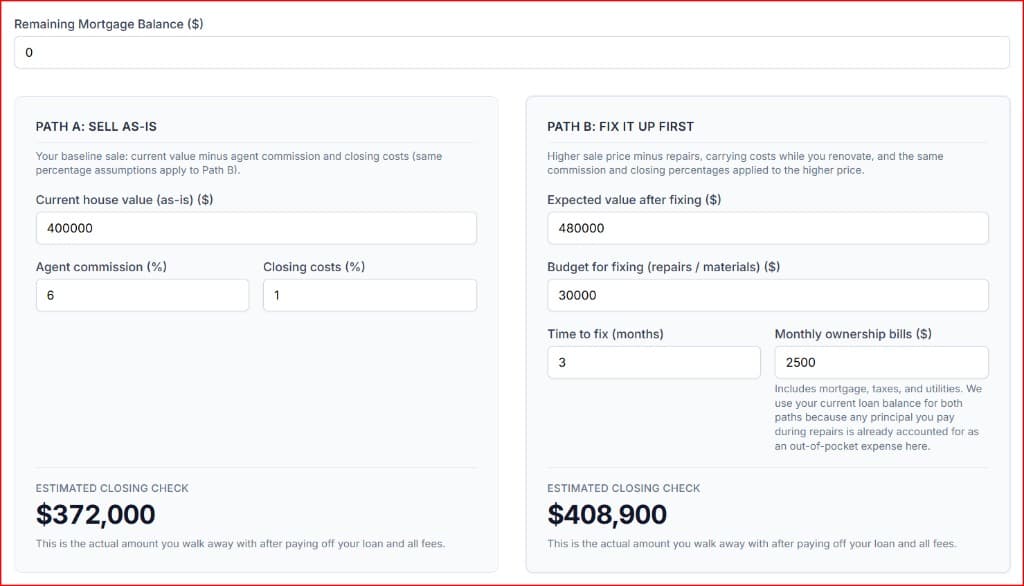
The Principal Paydown Illusion
One of the most misunderstood parts of the 'Fix It Up' path is how to categorize your monthly mortgage payments. Many view the entire payment as a 'cost' of waiting. Technically, it is an out-of-pocket liquidity drain, but it isn't entirely a financial loss.
The portion of your payment going toward principal is simply moving money from your bank account into your home's equity. You get that money back at the closing table. The true 'burn' is only the interest, taxes, insurance, and utilities. However, because you need cash to live after the sale, our calculator treats the entire monthly bill as a hurdle—because a higher net worth on paper doesn't help you pay a moving truck deposit if your cash is tied up in a house that hasn't sold yet.
Swipe horizontally or scroll to the right to view the full screenshot.
Time, Distance, and What the Next Address Really Costs
Sellers rarely connect the closing check to the commute they are about to inherit, but the connection is real: a "cheaper" house farther from work can silently tax your week while a more expensive zip code shortens it. If you are relocating after sale, run the trade-off as cash plus hours, not as sticker price alone. Our Drive Time vs. Mortgage Calculator exists to make that comparison explicit instead of something you rationalize after you move.
Geography also shapes burnout and margin for error—topics that sound soft until you are paying two rents during a delayed closing. For a grounded read on how place and fixed costs interact with stress, see The Hidden Geography of Burnout (Zip Code Edition). It is not a seller's checklist, but it is a useful lens when you are tempted to chase every last dollar of gross price at the expense of weekly life friction.
Renting, Buying Again, and the Liquidity Bridge
Many sellers become buyers again within months. In that window, your net proceeds are not just a trophy balance—they are the liquidity bridge that absorbs deposits, rate locks, moving vans, and the weird gap days when you technically own two places or none. If you underestimate that bridge, you end up leaning on credit cards or expensive short-term borrowing, which quietly eats the advantage you thought you gained from "winning" on price.
For a structured way to think about the rent-or-buy decision in a new market—especially when your net check is the input—read our Rent vs. Buy 2026 analysis. It complements the cash-at-closing story: you are not done when the wire hits; you are reallocating.
Paper, Insurance, and Servicer Friction
Insurance and escrow are where calm deals go sideways. A lapse in homeowners coverage during a transition can trigger force-placed policies or alarm your lender if you still carry a mortgage for even a week while overlapping ownership. If you are canceling or moving a policy around a sale, read the mechanics first—our guide on canceling homeowners insurance when you have a mortgage walks through who must be notified, in what order, and why rushing the wrong envelope can cost you.
Servicers also operate on their own clocks: payoff quotes expire, per diem interest accrues, and wire cutoffs are not sympathetic to your moving truck schedule. Build a buffer in your mind as well as your spreadsheet. The graphic below is a simplified sequence—your title company will drive the real order— but it shows why "the buyer paid" is not the same as "my old loan is satisfied."
A Stress-Test Checklist Before You Sign
- Normalize your offers: Build a net sheet for each viable offer using the exact same mortgage payoff figure, the same assumed closing date, and honest repair estimates. Then, vary only the variables that differ between buyers.
- Account for the 'Move-Out' tax: Add a post-closing buffer for moving costs, overlap rent, security deposits, and a three-month reserve. Do not treat your wire as 100% deployable equity.
- Audit the estimates: Ask your title or escrow officer which items are firm quotes versus estimates. If an item is still an estimate a week before closing, push for a firm revision before you sign.
If you do only one thing, make it this: repeat back your expected net in a single sentence to a professional who sees these statements daily. Misunderstandings are usually off-by-one-line-item errors, not math mysteries. Catching them early is free; catching them late is expensive diplomacy.
Summary: House Price vs. Cash at Closing
- Headline price is not bank balance: Payoffs, commissions, taxes, credits, and prorations sit between contract price and your wire. Compare offers on estimated net.
- Credits and repairs flip rankings: A higher sale with large seller concessions can lose to a lower, cleaner offer once everything settles—see the table above as a template.
- Renovation vs. as-is is a net problem: Use the Sell House As-Is vs. Fix It Up First Calculator to fold holding costs and project spend into the same view as sale proceeds.
- Equity choices continue after closing: The Pay Off Mortgage vs. Invest tool and true affordability framing help you think about what happens next, not just the day of funding.
- Bridge the life costs: Commute and place matter to monthly cash flow. Use Drive Time vs. Mortgage and burnout geography as sanity checks, and Rent vs. Buy 2026 if you are re-entering the market. Keep insurance changes orderly with the mortgage + insurance guide.