The Downsizing Trap: When a Cheaper House Comes With a More Expensive Mortgage Payment
Selling a larger home to buy a smaller one can still raise your monthly housing bill when the new loan carries a higher interest rate than the mortgage you are leaving behind. This article walks through how loan size, rate, taxes, and insurance combine; shows a dollar example of a cheaper home with a higher payment; and links to our Sell-to-Buy Calculator so you can tally moving costs and see whether monthly savings could ever offset them.
Published on

Downsizing often means a lower purchase price and, in many cases, less upkeep or a better location fit. Monthly housing cost, though, is not set by the list price alone. It depends on what you borrow, the interest rate on the new loan, and the taxes and insurance tied to the new address.
When the home you are leaving still has a mortgage originated at a lower rate, the replacement loan is priced at current market terms. A smaller loan balance can still produce a higher monthly housing bill if each borrowed dollar costs more in interest. That pattern—cheaper home, higher payment—is worth modeling before you list.
Use our Sell-to-Buy Calculator to add up one-time moving costs, compare old and new monthly payments, and see whether a break-even timeline exists when your new bill is lower.
Purchase Price and Monthly Payment Are Different Numbers
Purchase price is what you agree to pay for the property. Monthly housing bill—often summarized as PITI (principal, interest, taxes, and insurance)—is what leaves your account every month. Lenders and household budgets run on the monthly number; listings and negotiations emphasize purchase price.
Downsizing changes purchase price and every component of the monthly bill. Loan size may fall, but the rate on the new mortgage, the tax assessment at the new address, and a fresh insurance quote can move in the other direction. A lower purchase price is one input; it does not, by itself, set the monthly obligation.
What Moves Your Monthly Payment When You Downsize
Four inputs together determine the new monthly bill. Downsizing reliably affects the first; the other three reset when you buy a different property on a new loan.
Loan balance
A smaller purchase price (minus whatever you put down from sale proceeds) means a smaller loan. That tends to reduce principal and interest—all else equal.
Interest rate on the new loan
A purchase triggers a new mortgage priced at current market rates, not the rate on the loan you are paying off. A higher rate increases interest cost per dollar still borrowed. Homeowners who locked in lower fixed rates years ago often face this reset when they sell and buy again.
Property taxes
Taxes are reassessed at the new address. A lower-priced home often means a lower assessed value, but a different municipality, county mill rate, or reassessment timing can raise or lower the line item independently of square footage.
Homeowners insurance
A new policy reflects the dwelling, roof age, flood or wind exposure, and carrier pricing. Insurance can change even when the home costs less than the one you sold.
Model two scenarios—different loan amounts and rates—by running our Mortgage Calculator twice before you assume a smaller price tag equals a smaller monthly bill.
Example: $380,000 Home, $3,100 Monthly Bill vs. $2,400 Today
The table below is a hypothetical illustration, not a quote for your specific market. It shows how a lower purchase price can coexist with a higher monthly housing bill if the existing mortgage carries a lower interest rate and you choose to pocket your cash proceeds rather than rolling all your equity into the next down payment.
In this scenario, a household sells a home valued at $450,000 where their total monthly housing bill is locked in at $2,400. They downsize to a smaller home with a cheaper sticker price of $380,000. However, instead of dumping all their liquid sale proceeds into the new property, they opt for a standard minimum down payment and invest or pocket the remaining cash equity elsewhere.
Because their new mortgage is priced at today's market rates near 6.1%, each borrowed dollar costs significantly more in interest than the 3.5% loan they left behind. This causes their new monthly payment to jump to $3,100. Despite moving to a cheaper property, their monthly overhead increases by $700 every single month.
| Financial Metric | Current home (selling) | New home (buying) |
|---|---|---|
| Role in example | Home being sold | Smaller home being purchased |
| Purchase / value context (illustrative) | ~$450,000 | $380,000 |
| Mortgage rate (illustrative) | ~3.5% (existing loan) | ~6.1% (new loan) |
| Monthly housing bill (PITI) | $2,400 | $3,100 |
| Change | — | +$700 / month |
Swipe horizontally or scroll to the right to view the full screenshot.
Moving Still Has Upfront Costs—Separate From the Monthly Bill
Sell-then-buy means two closings: exit costs on the home you leave and entry costs on the home you purchase. Those fees hit savings regardless of whether the new home costs less.
On the sell side, agent commission scales with sale price, plus repair or staging and moving. On the buy side, lender closing fees and immediate move-in improvements add more. Even when purchase prices are similar—a "sideways" trade—the stack can total tens of thousands of dollars.
| Fee line | How it is sized (illustrative) | Example amount |
|---|---|---|
| Agent commission (sell) | 6% × sale price | $27,000 |
| Lender closing costs (buy) | ~3% × purchase price | $13,500 |
| Professional moving truck | Flat fee (example) | $1,500 |
| Total moving cost (approx.) | Sum of lines above | ~$42,000 |
On a true downsize, the buy-side percentage fees may shrink with a lower purchase price, but sell-side commission still scales with the value of the home you leave. Tally exit and entry lines separately in the Sell-to-Buy Calculator. For how sale price differs from net cash after closing—not the same math as sell-to-buy moving costs, but part of the same decision—see When Your Home Sells for More but Your Closing Check Barely Changes.
When a Move Can Pay Back Moving Costs—and When It Cannot
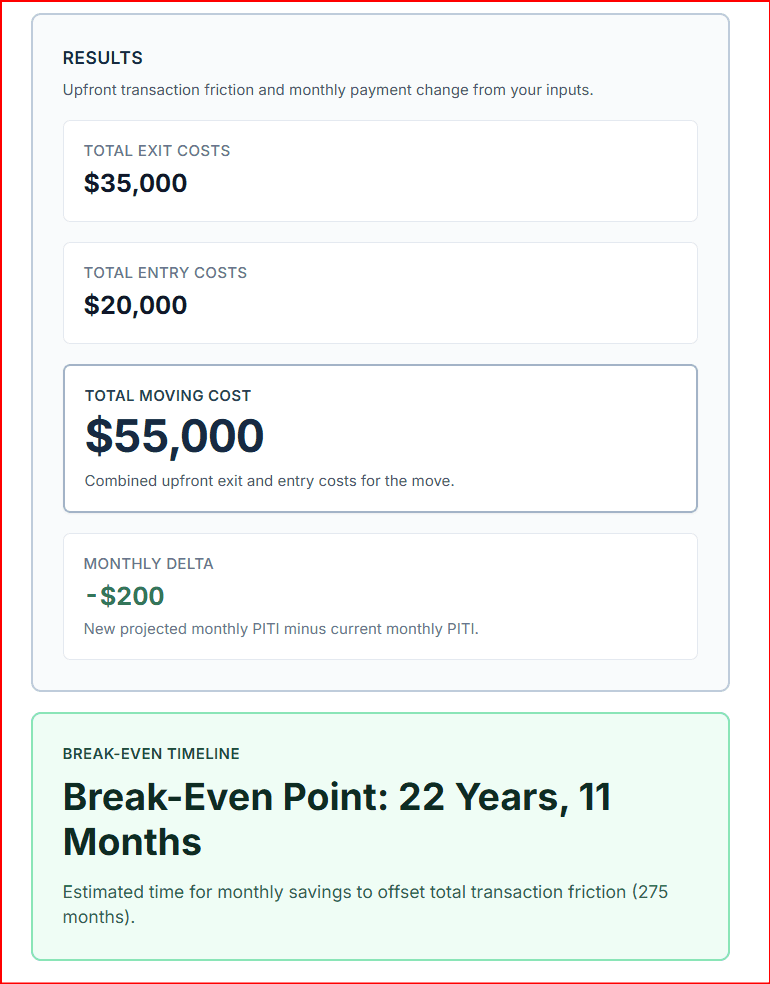
Break-even, in this context, is how long monthly savings on housing must accumulate to equal your one-time moving costs (what the Sell-to-Buy Calculator labels Total Moving Cost). The math only runs when your new monthly housing bill is lower than your old one.
When break-even exists
If new PITI is below current PITI, divide total moving cost by the monthly difference. The result is the number of months until cumulative savings offset upfront fees. The calculator converts that to years and months for your stated inputs.
When break-even does not exist
If the new bill equals the old bill, moving costs are spent without any monthly savings to recoup them through lower housing payments. If the new bill is higher, moving costs are spent and monthly overhead rises—there is no break-even timeline from payment savings alone.
Same or higher monthly bill: the calculator will show that you will not break even on moving costs from monthly savings alone. That is one metric—not a verdict on whether the move fits your goals.
Cash at closing, less maintenance, commute, or layout can still justify downsizing when the monthly line rises. The point is to see the trade before you commit.
When Downsizing Still Fits Your Goals
- Net cash from sale: Lower lien plus accumulated equity can mean more liquid cash after closing—even when the new payment rises. Pair with gross vs. net proceeds framing so you know what actually lands in the bank.
- Operating costs: Less square footage, yard, or deferred maintenance are real savings not fully captured in PITI.
- Location and commute: A shorter drive or better zip for daily life may outweigh a higher mortgage line—model commute dollars in the Drive Time vs. Mortgage Calculator.
- Fixed payment today: Locking a known payment can be a deliberate trade if you value certainty over keeping an old rate on a home that no longer fits—without treating future rate moves as a plan.
- Refinance if rates fall: A possible future path, not a baseline assumption. See why a low fixed rate has value over time for context on the loan you are giving up.
If the primary objective is a lower monthly housing cost, model new PITI from a Loan Estimate before listing. When payment rises, that objective is not met by purchase price alone.
When the Downsizing Trap is Worth It: The Equity Math
Accepting a higher monthly mortgage payment of $700 can still be a smart financial decision if the move unlocks a large amount of cash from your home equity. For example, if selling your larger house allows you to walk away with $150,000 in liquid cash, that money can be put to work elsewhere.
Placing that $150,000 into steady investments yielding a conservative 6% returns roughly $750 a month in new income. That new cash flow completely offsets the $700 higher mortgage bill while keeping $150,000 liquid in your portfolio. The move is a net win if the income generated from the cash you free up is larger than the increase in your monthly bills.
Checklist Before You Sell to Buy Smaller
- Record your current full monthly housing bill (PITI, plus HOA if any).
- Get a projected full monthly bill on the target home from a lender quote—not from list price alone.
- Estimate total moving cost (commission, closing, moving, immediate repairs).
- Note whether a break-even timeline exists; if new PITI is flat or higher, say so explicitly in your notes.
- Write down your primary goal for the move—monthly savings, cash, space, location—and check whether the numbers support that goal.
- Compare the cash you get at closing against your total moving costs. If your upfront fees consume more than 25% of the equity you free up, re-evaluate if the move is worth the transaction drag.
Run the three layers together in the Sell-to-Buy Calculator. For how current mortgage rates and ownership costs compare to renting, see Rent vs. Buy in 2026; for what a lender approval amount leaves out of your real budget, see true home affordability beyond DTI.
What This Analysis Does Not Include
Use this article and calculator to structure your own inputs—not as tax, legal, or personalized financial advice. Items the Sell-to-Buy model does not capture include:
- Capital gains on a primary residence (federal exclusion limits may apply; large gains warrant a CPA).
- Transfer taxes and local recording fees (vary by state and county).
- Rent or a gap between sell and buy closings.
- Major renovation budgets beyond immediate move-in improvements.
- Opportunity cost of deploying equity elsewhere—including whether to pay down your current loan or invest that cash before you sell, which the Pay Off Mortgage vs. Invest Calculator compares directly (not a sell-vs-buy model on its own).
Summary: Cheaper Sticker, Higher Payment
- Purchase price and monthly bill can diverge when loan size, rate, taxes, and insurance do not all move in the same direction.
- A higher rate on a smaller loan can produce a higher monthly bill than a larger loan at a lower rate—especially when leaving a long-held fixed rate.
- Moving costs are additive: commissions, closing, and moving hit savings even when the new home costs less; see the illustrative ~$42,000 stack above.
- Break-even requires a lower monthly bill. Identical or higher new PITI means no timeline to recoup moving costs from payment savings alone.
- Model your inputs: Sell-to-Buy Calculator; related tools: Pay Off Mortgage vs. Invest (prepay vs. invest extra cash), Mortgage Calculator, and Rent vs. Buy in 2026 (ownership vs. rent at current rates).