The Mathematics of Financial Independence: How to Engineer Your Early Retirement
Build a predictable roadmap to your first million using the "Triple-Lever" framework—Time, Rate, and Contribution.
Published on

Achieving financial independence often feels like a distant, complex goal reserved for the lucky few. However, when you strip away the market noise and complex jargon, wealth building is rarely about luck—it is about math.
Financial freedom is an engineering problem. It is the result of a predictable interaction between three simple variables: the time you have, the rate your money grows, and the amount you contribute. By understanding how these "levers" work together, you can stop hoping for a comfortable future and start building one with precision.
Here is the mathematical blueprint to engineering your wealth, step-by-step.
Lever 1: The "Time" Multiplier
The first variable in your formula is Time, and it is arguably the most forgiving.
A common fear among investors is buying at the "wrong time." However, data consistently shows that time in the market beats timing the market. According to a study by Vanguard, even in a worst-case scenario—where an investor bought into the market at the absolute peak before a crash every single time—they still generated positive annual returns of nearly 11% simply by staying invested rather than moving to cash.
This is due to the exponential nature of compounding. The money you invest in your 20s or 30s has decades to multiply, making it significantly more powerful than money invested later in life.
$1 invested at age 20 (at 8% return) becomes $31.92 by age 65.
$1 invested at age 40 (at 8% return) becomes just $6.85 by age 65.
(Note: While inflation will reduce the purchasing power of that future amount, the raw growth multiplier remains undeniable.)
This concept is explored deeply in our guide on The Cost of Waiting to Invest, where we break down the exact dollar amount lost for every year of delay.
The "Gap" Visualized: Use the SVG below to visualize how a 10-year delay creates a gap that is almost impossible to close with savings alone.
Lever 2: The "Growth" Velocity
Once you have committed to the timeframe, the next question is: How fast is the vehicle moving?
Historically, the S&P 500 has returned an average of approximately 10%+ annually before inflation. However, inflation eats away at your purchasing power, meaning your "real" return is often closer to 6-7%.
Understanding this rate is critical for goal setting. If you know your interest rate, you can predict exactly when your money will double. There is a mental math shortcut for this called the Rule of 72.
At a 10% return, your money doubles every 7.2 years.
At a 4% return (a typical high-yield savings account), it takes 18 years.
Knowing this number helps you determine if your current investment strategy is aggressive enough to meet your retirement date. You can learn exactly how to use this mental math trick in our article: What is the Rule of 72?.
The Doubling Effect: This visual demonstrates how a higher rate dramatically shortens your timeline.
The Friction Variable: Expense Ratios
A common math error is ignoring the 'friction' of investment fees. While a 1% management fee or expense ratio sounds negligible, it compounds negatively over decades. On a $100,000 investment growing at 8% over 30 years, a 1% fee reduces your final balance from $1.01M to approximately $760,000—a $250,000 mathematical penalty. For the precision investor, keeping fees below 0.20% is as important as the return rate itself.
Lever 3: The "Contribution" Engine
The final piece of the puzzle is the engine itself: Compound Interest.
Albert Einstein is often credited with calling compound interest the "eighth wonder of the world." While the exact origin of the quote is debated by historians, the math behind it is undeniable.
In the early years of your journey, your contributions (the money you save from your paycheck) do the heavy lifting. But how much should you contribute?
According to research by Fidelity, successful retirees who maintain their lifestyle typically hit specific "checkpoint" multipliers:
- Age 30: Have 1x your annual salary accumulated in retirement/and or investment accounts.
- Age 40: Have 3x your annual salary accumulated in retirement/and or investment accounts.
- Age 50: Have 6x your annual salary accumulated in retirement/and or investment accounts.
To hit these aggressive targets, the standard advice of saving "whatever is left over" rarely works. Instead, Fidelity suggests following the 15% Rule: aim to invest at least 15% of your pre-tax income annually.
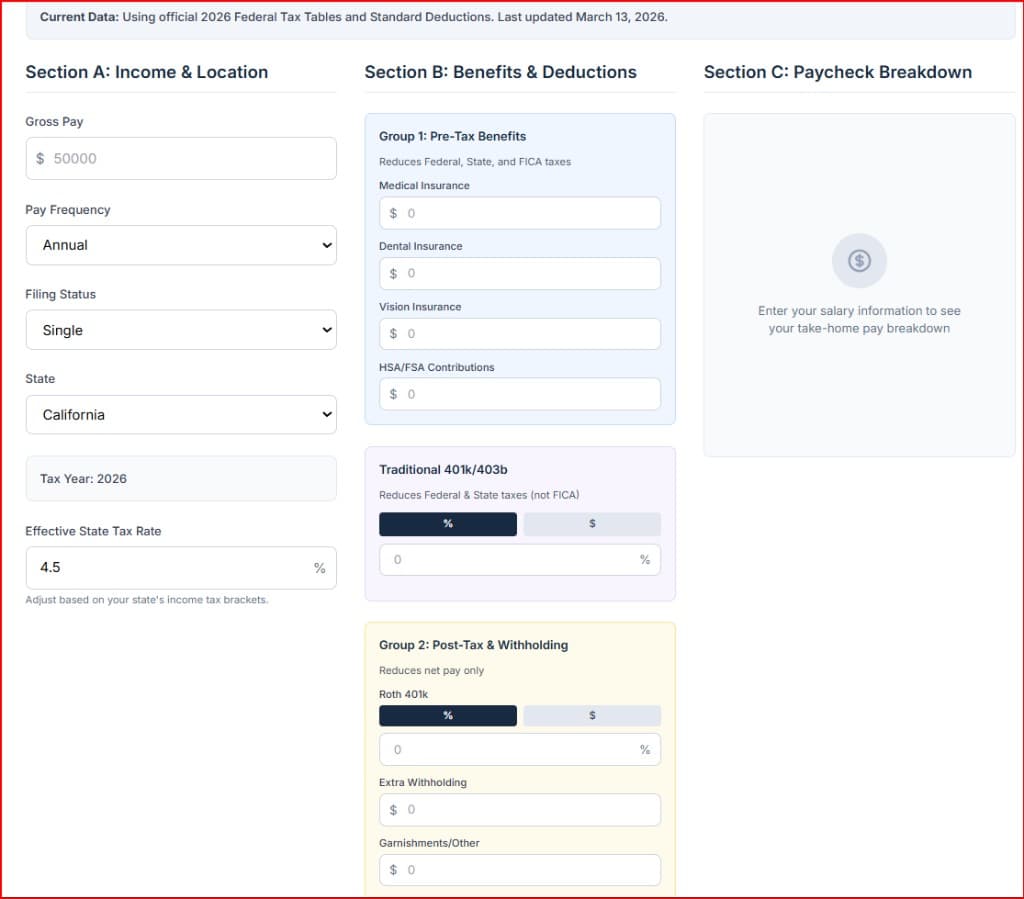
To see what a 15% deduction looks like on your actual take-home pay, you can run the numbers on our Paycheck Calculator.
Realizing the Gap: Gross vs. Net Income
Swipe horizontally or scroll to the right to view the full screenshot.
Defining the Goal: Salaried Independence
In financial engineering, Financial Independence (FI) is the specific moment your passive income from assets covers 100% of your living expenses. You are no longer trading your time for currency; you are living on the 'work' of your capital.
To calculate this target, professionals use the Inverse 4% Rule. Based on historical market data (the Trinity Study), a diversified portfolio can safely sustain a 4% annual withdrawal indefinitely. Mathematically, the inverse of 4% is 25 (1 / 0.04 = 25).
The Formula: Multiply your expected annual expenses by 25. If your household requires $60,000 per year to function, your mathematical independence number is $1.5M.
Putting It All Together
Financial independence isn't about guessing; it's about reverse-engineering.
- Calculate the Reality: Use an ROI Calculator to see what your real returns look like.
- Automate the Process: Use our Compound Interest Calculator to find your "crossover point"—the moment your investment returns earn more in a single year than your salary does.
- Start Immediately: Remember the cost of waiting. Even small amounts invested today beat large amounts invested tomorrow.
| Lever | What you actually control | How it compounds |
|---|---|---|
| Savings rate | How much you earn vs. keep after spending. | Increases the principal; provides the base amount that the growth multiplier acts upon. |
| Real return | Asset mix, expense ratios, tax placement, and emotional discipline. | Multiplies the base you already built—volatile, so think in decades. |
| Time | Start date, consistency, and avoiding long idle cash. | Functions as the exponent in the growth formula; a longer duration allows for a parabolic 'hockey stick' curve. |
Summary: Key Takeaways
- Time is Your Greatest Asset: Missing the "best days" in the market or sitting in cash can drastically reduce your ending balance.
- The Rule of 72: Divide 72 by your expected return rate to instantly know how many years it takes to double your money.
- Benchmarks Matter: Aim to have 1x your salary saved by age 30 and 3x by age 40 to stay on track.
- Real Returns: Historically, the S&P 500 returns ~10%, but always account for inflation when planning your purchasing power.
- Salaried Independence: True FI is reached when asset yield covers 100% of annual expenses.
- The 25x Multiplier: Calculate your retirement target by multiplying your expected annual spending by 25.
- Control the Drag: Prioritize low-cost index funds; a 1% fee can mathematically consume nearly 25% of your total wealth over a 30-year horizon.