Beyond Raw Numbers: Mastering the Percent Change Calculator
Context is everything. Learn how measuring relative growth, rather than just absolute difference, leads to smarter financial and personal decisions.
Published on

If you are told that a company's profit increased by $10,000 last month, do you know if that is impressive?
If that company is a lemonade stand, a $10,000 increase is monumental. If it is a Fortune 500 corporation, that amount is a rounding error.
Raw numbers tell you what happened, but they rarely tell you how important it was. To understand the magnitude of a shift—whether it's in your stock portfolio, your business revenue, or the price of groceries—you need context.
That context comes from calculating Percent Change.
The Crucial Distinction: Percentage Points vs. Percent Change
In professional analytics, one error consistently causes costly misinterpretations: confusing percent change with percentage points. If an interest rate moves from 5% to 6%, it has increased by one percentage point. However, relative to the original 5% value, that is actually a 20% increase.
When reading reports, check if the author is talking about the absolute change (points) or the relative change (percent). If you are using our Percent Change Calculator, always confirm whether your "initial value" is a percentage (like an interest rate) or a raw number (like revenue). Mixing these up—or treating percentage points as percent change—will drastically distort your data and can lead to flawed strategic decisions.
The Tool: Precision in Calculation
Percent change measures the relative difference between an initial value and a final value over time. It tells you the directional trend of a data point.
We designed our Percent Change Calculator to handle these calculations rigorously.
Percentage Change Calculator Interface
Swipe horizontally or scroll to the right to view the full screenshot.
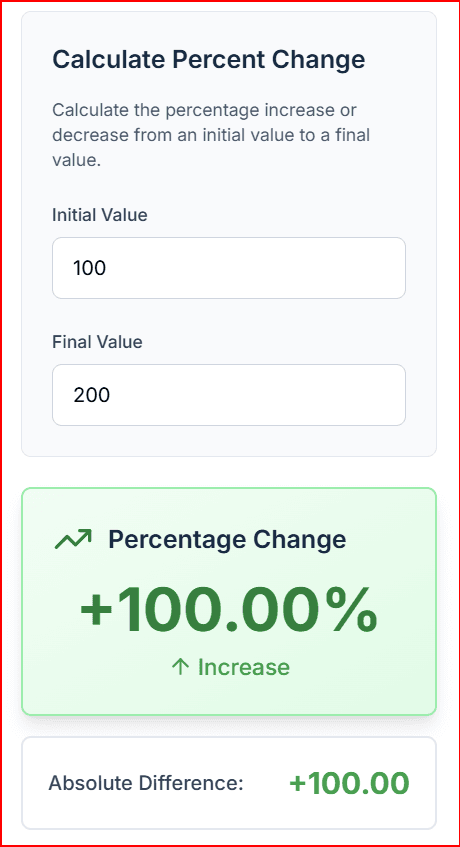
Unlike basic calculators that might fail when dealing with negative starting points (like calculating growth from a business loss to a profit), our formula uses the absolute value of the initial number in the denominator. This ensures that whether your starting point is positive or negative, the resulting growth percentage is logically consistent and indicates the correct trend direction.
Here is how this tool applies to everyday scenarios.
Business and Financial Health
In finance, the raw dollar amount of growth is secondary to the rate of growth. Investors and business owners use percent change to track momentum.
Revenue Growth (MoM/YoY): Tracking Month-over-Month or Year-over-Year revenue is essential for spotting trends. A consistent 15% MoM growth rate is a powerful indicator of business health.
Stock Market Trends: An investor doesn't just care that a stock went up $5. They care that it went up $5 from a $20 starting price (a significant 25% gain) versus a $500 starting price (a minor 1% fluctuation).
Smarter Shopping and Inflation Tracking
Consumers are constantly bombarded with "deals." The Percent Change calculator helps verify if a discount is actually significant.
Verifying Discounts: If an item was listed at $50 and is now on sale for $30, entering these into the calculator reveals a -40% change. This helps you compare sales across different retailers to ensure you are getting the best relative value.
Tracking Price Creep: You can also use the tool to monitor inflation on household goods. If your standard grocery bill jumped from $150 last month to $175 this month, that's a 16.7% increase—a figure that helps you adjust your budget accordingly.
Personal Progress Tracking
When working toward personal goals, progress can sometimes feel slow if you only look at daily numbers. Viewing progress as a percentage can provide motivation and a clearer picture of success.
Fitness Goals: Tracking weight loss not just by pounds, but by percentage of body weight lost, gives a better perspective on health improvements.
Savings Goals: Watching a savings account grow from $1,000 to $1,100 is a 10% increase. Tracking this percentage over time encourages consistent saving habits.
Mental Sanity Checks: Estimating Growth Without a Calculator
You don't always need a calculator to sense if a percentage change "feels" right. Keeping these three benchmarks in mind helps you spot errors or deceptive claims before you even touch the keyboard:
The Doubling Rule: If a value doubles, it's a 100% increase. If it triples, it's a 200% increase. If you see a claim that an investment "tripled" but the calculator shows a 100% increase, something is wrong.
The Half-Life Check: If a value is cut in half, it's a 50% decrease. If it's cut by three-quarters, it's a 75% decrease.
The 10% Quick-Check: Move the decimal point of your baseline value one place to the left. For example, 10% of $500 is $50. If your reported "change" is only $5, you instantly know it's a 1% change, not 10%. If the reported change is vastly different from that 10% baseline, you know the percentage must be significantly higher or lower.
Developing this "number sense" ensures that when you do use our calculator, you are validating your data rather than blindly trusting the output.
Make Data-Driven Decisions
Whether you are analyzing a quarterly earnings report, evaluating a Black Friday sale, or tracking your personal goals, stop relying on raw numbers alone.
Use the Percent Change Calculator to gain the necessary context. By understanding the relative rate of change, you can make smarter, more informed decisions in every aspect of your life.
| Scenario | Old vs. new (roles) | Formula choice |
|---|---|---|
| A clear starting value and a later value | Old = baseline; new = current | Percent change: expresses growth or decline relative to where you started. |
| Two quotes or measurements with no natural “first” | Neither number is inherently the reference | Percent difference: symmetric comparison that does not depend on which value you list first. |
| Sale tag says “was / now” | “Was” is the reference price; “now” is the offered price | Percent change from the original price shows the discount depth shoppers care about. |
| Tracking a KPI over many periods | Each period has its own prior value | Chain period-over-period percent changes; the baseline shifts every step. |
Summary: The Importance of Percent Change
- Context is Key: Absolute numbers tell you what changed; percent change tells you the significance of that change relative to where you started.
- Understanding Technical Nuance: Learn to distinguish between percent change and percentage points to avoid common, costly analytical errors.
- Direction Matters: Percent change clearly indicates positive growth (increase) or negative trends (decrease).
- Business Application: Essential for tracking MoM and YoY revenue growth and analyzing stock performance.
- Consumer Application: Used to verify actual discount percentages on sale items and track rising costs due to inflation.
- Personal Application: A motivating way to track progress on health, fitness, and savings goals.
- Building Number Sense: Use simple mental math benchmarks—like the "Doubling Rule" and the "10% Quick-Check"—to validate data trends without relying on a calculator.