How Software Technical Debt Adds Up for Web and App Teams
A practical look at how fix-and-maintain work on websites and apps adds up in engineering time—and how to estimate those hours over the years ahead.
Published on

When people talk about technical debt in a software context, they mean the ongoing developer time a website or app codebase needs just to stay working—fixes, updates, dependency bumps, and the slow work that keeps yesterday's decisions from blocking tomorrow's features. This article is about that kind of debt: hours logged by web and app engineers, not debt in a factory machine shop or a civil engineering project.
The useful question is not whether your team ever carries debt—almost every shipping product does—but how many hours per week it quietly consumes, and whether that load stays flat or creeps upward. Once you can see the hours, you can compare them to a focused cleanup project, a rewrite, or simply accepting the pace for a while. Our Technical Debt Interest Calculator turns those weekly hours into a multi-year picture; this guide explains what each input means and why the total can grow even when your headcount does not.
What Software Technical Debt Means for Web and App Teams
Picture a product team with a fixed number of developers. Some of their week always goes to keeping the live site or app healthy: patching a checkout bug, updating a library before a security notice, adjusting an API after a partner changes their docs, or untangling why a page loads slowly on one browser. That recurring upkeep is the heart of software technical debt. It is not a moral failing; it is the normal cost of software that has been in the world long enough to accumulate history.
Debt shows up whenever past choices—often reasonable at the time—make present work take longer than it would on a greenfield build. A quick integration that skipped tests, a data model that never got refactored when the catalog doubled, or a front-end pattern from three framework generations ago all add minutes to tasks that should feel routine. Those minutes become hours, and hours become the slice of your roadmap that never reaches users as new capability.
For founders, product managers, and engineering leads who do not live in the codebase daily, the important signal is time, not guilt. If four engineers each lose half a day every week to debt work, that is sixteen hours of capacity gone before anyone opens a ticket for a customer-facing feature. Naming that number makes tradeoffs visible: hire to absorb the load, fund a reduction sprint, or deliberately defer and accept slower delivery.
Where Those Developer Hours Actually Go
Debt hours rarely arrive labeled "technical debt" on a timesheet. They hide inside categories everyone recognizes: bug fixes, support escalations, "small" refactors that balloon, and release work that should have been a one-line change. Grouping them mentally helps when you estimate how much of a typical week is maintenance versus net-new product work.
Fixes and firefighting
Production issues are the most visible slice. A payment edge case, a broken form on mobile, or an integration that fails when a third party rotates credentials can pull multiple engineers off planned work. Even after the incident closes, follow-up tasks often remain: add monitoring, document the workaround, or harden the path so the same class of failure is less likely next quarter.
The same ticket can sprawl when the fix touches more than one layer—say, a UI change, an API adjustment, and a deploy or config check before anything ships. That is one reason debt hours often run higher than the time spent on the symptom alone. If you want a separate walkthrough of how those layers connect on a typical modern web stack, see our guide on React, JavaScript, Next.js, and the App Router.
Updates that feel slower each time
Dependency updates, security patches, and platform upgrades (hosting, database, CI) are necessary but seldom free. The first time you bump a major version might take an afternoon. The fifth time, if the codebase sprouted conditional branches and one-off shims, the same class of upgrade can take days because every exception needs retesting.
That slowdown is one practical definition of debt: the same category of work costs more calendar time than it used to. Tracking how long recurring chores take quarter over quarter often reveals debt earlier than counting open tickets.
Work that keeps the lights on
Not all debt hours are dramatic. A steady drip includes updating copy in twelve places because content is duplicated, adjusting reports when a field meaning drifted, or manually syncing data that was never automated. None of it is wasted—users depend on the product working—but it competes directly with roadmap items that grow revenue or reduce churn.
A useful exercise: ask the team, "If we froze all new features for one week, what would we still have to do to stay safe and compliant?" The answer is a lower bound on debt-related hours. Add incident response and "why did this take so long?" tasks from the last sprint, and you are closer to an honest weekly number for the calculator.
Why the Load Can Grow Year After Year
Many teams assume debt hours stay flat if staffing stays flat. Experience often says otherwise. As a codebase ages, each change touches more surface area: more tests to run, more modules that import each other, more customers on legacy paths you cannot turn off yet. The same org can spend a slightly larger share of each week on upkeep even when no single disaster happened—and that drift is what makes multi-year estimates worth doing.
Brittleness: when the codebase gets easier to break
In the calculator on this site, brittleness rate is the yearly increase you expect in debt-related effort because the system gets harder to change safely. Think of it as the percentage bump in maintenance load each year if you do not actively pay debt down. Zero percent means you believe hours stay level; ten percent means you expect next year's upkeep to take about ten percent more effort than this year's, and so on.
Brittleness is not a precise physical measurement—it is a planning knob. A mature product with heavy customization for enterprise clients might warrant a higher rate than a young SaaS app with few integrations. The point is to capture compounding friction: the second year of deferring a messy module rarely costs the same as the first.
How small yearly growth stacks up
A flat estimate—"we spend $200k a year on debt forever"—understates the total when brittleness is positive. Year one might feel manageable. By year five, the same team can be spending noticeably more time on the same categories of work, and the gap between "flat" and "growing" planning lines is what we call the innovation gap in the calculator: extra cost above keeping year-one hours constant.
This is the same broad shape as other things that grow on a percentage each year—like interest on a savings balance—but here the thing growing is maintenance effort, not dollars in a bank account. Our Mathematics of Compound Interest article walks through money compounding in detail; read it for the finance side, and use the debt calculator when the quantity you care about is developer hours turned into budget.
A Simple Way to Put Numbers on It
You do not need a forensic audit to get a useful estimate. Start with weekly debt hours across the team—the time spent on upkeep categories we described above. Multiply by 52 for annual hours. Multiply by a blended hourly cost (salary, benefits, contractors, loaded rate—whatever you already use for budgeting). That gives a direct maintenance cost. The calculator adds two more ideas: an opportunity multiplier and brittleness over a time horizon.
What each calculator input represents
Weekly debt hours is the raw time sink—one number you can sanity-check in a sprint retro. Hourly rate turns hours into dollars (or your currency) the way finance already tracks engineering cost. Opportunity multiplier captures work that never happened because capacity was busy patching: delayed features, slower experiments, longer sales promises. A multiplier of 1.0 counts only direct hours; 1.5 or 2.0 acknowledges that an hour lost to debt often costs more than an hour of payroll when roadmap slip has revenue impact.
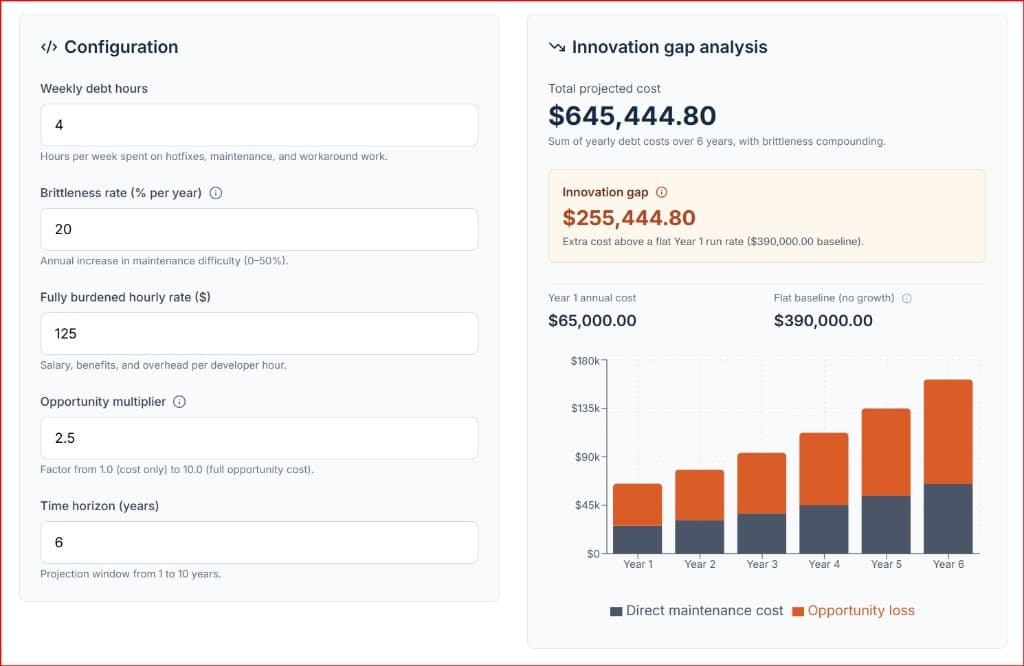
Brittleness rate and time horizon stretch the estimate forward. Each year's total equals the previous year's total multiplied by (1 + brittleness ÷ 100). Summing those years and comparing to a flat baseline yields the innovation gap—helpful when someone asks, "Is it cheaper to invest two months now or keep paying the tax?"
Worked example you can trace
Suppose debt work averages 8 hours per week across the team. That is 416 hours per year. At a blended $75/hour, direct maintenance is about $31,200 in year one. With an opportunity multiplier of 1.5, year-one total impact is about $46,800—the extra slice models roadmap work you did not ship. To make this numbers-driven reality even clearer for executive leadership, translate those weekly hours into Full-Time Equivalents (FTEs). For instance, if a larger team's combined debt service totals 60 hours a week, you aren't just losing abstract capacity—you have exactly 1.5 FTE engineers completely locked down just keeping the lights on instead of shipping the roadmap.
If brittleness is 10% and you look ahead 5 years, each year's total is 10% higher than the last. Year five lands near $68,500 in total impact versus the $46,800 you would have spent if hours stayed frozen in year one. Add the five years together and compare to five flat years at $46,800—you are roughly $52,000 above the flat baseline. That gap is the price of compounding friction, not a single bad release.
Plug your own numbers into the Technical Debt Interest Calculator to see direct cost versus opportunity loss stacked by year. Adjust brittleness down if you are actively refactoring, or up if integrations and custom rules are proliferating.
Projections for a High-Risk Codebase
Swipe horizontally or scroll to the right to view the full screenshot.
| Input | What you are estimating | Where teams often get the number |
|---|---|---|
| Weekly debt hours | Time spent on fixes, upgrades, rework, and release tax | Sprint retro, support ticket tags, or a one-week freeze exercise |
| Hourly rate | Fully loaded cost of an engineering hour | Finance blended rate or (salary + benefits) ÷ working hours |
| Opportunity multiplier | How much roadmap value each debt hour displaces | 1.0 for base labor cost; 2.0–3.0× when release delays impact product revenue and time-to-market. |
| Brittleness rate | Expected yearly increase in upkeep effort | Historical trend of release duration or upgrade project size |
| Time horizon | How many years you want to model | Your company's planning cycle—typically 3–5 years for long-term strategic roadmaps or architectural updates. |
Same Growth Pattern as Compound Interest—Different Collateral
Money in a savings account and maintenance hours on an aging app both can grow by a percentage each period—but they are not the same thing. Compound interest adds dollars to a balance; brittleness adds friction to change. The formulas rhyme (each year multiplies the prior year by a growth factor), yet the collateral differs: one is cash, the other is your team's calendar.
That distinction matters when you talk to finance stakeholders. You are not claiming code debt has an interest rate like a loan. You are saying, "If we do nothing, the same categories of work likely consume more hours next year, and here is how that stacks." For money-side compounding intuition, the Compound Interest Calculator is the right tool; for engineering capacity, use the debt calculator. Choosing between a one-time refactor budget and ongoing carry cost also rhymes with subscription versus upfront decisions—our monthly vs. one-time costs break-even framing can help structure that conversation without mixing up the math.
Using the Estimate in Real Planning
A model is only useful if it changes a decision. The debt calculator is deliberately small: a handful of inputs you can defend in a meeting. The output is not a prophecy; it is a shared picture of what happens if current patterns continue—and how much a flat-hours assumption might undercount.
Start with an honest weekly number
Underestimating debt hours makes every ROI story for cleanup look worse than it is. If the team says half a day per person is realistic, use that before negotiating down. You can always run a second scenario with a lower brittleness rate to show what active investment buys you.
Revisit the inputs each planning cycle. Debt paid down should show up as lower weekly hours or a lower brittleness assumption. If neither moves after a "refactor quarter," that is a signal the work did not touch the friction that matters—or that new scope replaced the savings.
Compare a cleanup spend to years of carry cost
When someone proposes a six-week hardening project, stack its fully loaded cost against the innovation gap from the calculator. If carrying debt likely costs $40k extra over five years and the project costs $25k one time, the conversation shifts from "can we afford it?" to "can we afford not to?" The numbers will not decide for you—risk and customer promises still matter—but they stop the debate from living purely in anecdotes.
Infrastructure choices feed the same ledger. Running lean on caching or egress can shift dollars from hosting to engineering time spent firefighting performance. If your product is public-facing and data-heavy, pairing this estimate with our cache hit ratio and latency guide helps separate "we pay more for servers" from "we pay more for engineers because the app is fragile under load."
Key Takeaways
Software technical debt is the recurring developer time a web or app codebase needs for fixes, updates, and upkeep—not generic "technical" work in other industries. Naming weekly debt hours makes hidden roadmap drag visible before headcount plans harden.
Debt load often grows year over year even without a major outage, because older systems take longer to change safely. Brittleness rate models that yearly increase; summed over a time horizon it produces an innovation gap above flat year-one spending.
The Technical Debt Interest Calculator turns hours, hourly cost, opportunity multiplier, brittleness, and horizon into direct maintenance cost, opportunity loss, and multi-year totals—useful for comparing a one-time cleanup to years of carry cost. For the money-compounding intuition (different collateral, similar growth shape), see Mathematics of Compound Interest and the Compound Interest Calculator.