The Definitive Guide to CAGR: Understanding Your True Annual Returns
Learn how the Compound Annual Growth Rate (CAGR) can provide a clearer, more accurate picture of your investment performance over time compared to simple averages.
Published on

Most people judge an investment by looking at a few big wins and a few scary drops and then guessing. You might think, "Some years were up, some were down… overall it's probably fine." But that doesn't tell you the one number you actually care about: "On average, how fast did my money really grow each year?"
The Compound Annual Growth Rate (CAGR) answers that question in a clean way. It takes the value you started with, the value you ended with, and the number of years in between, and converts that into a single "as-if" growth rate. In plain English, it tells you: "If my investment had grown at the same steady percentage every year, what would that yearly percentage have been to get from start to finish?"
CAGR at a Glance
- CAGR formula:
- Use it when: You want a clean, apples-to-apples comparison of investments over different time horizons.
- What it hides: Volatility and drawdowns. CAGR assumes a smooth path that rarely exists in real markets.
- How to adjust: Pair CAGR with inflation and risk metrics to understand real, after-inflation returns.
The Core Equation for CAGR
You do not need to memorize this formula. What matters is the idea behind it. Instead of adding each year's gain and dividing by the number of years (a simple average), CAGR works backwards from two numbers you already know: what you put in and what you ended with. It then solves for the one "mystery" number: the steady annual growth rate that would connect those two points.
CAGR Formula
- — how much you started with.
- — how much you ended with.
- — how many years you were invested.
In other words, CAGR is just a tidy way of saying, "If this account had grown smoothly instead of bouncing around, what steady yearly percentage increase would connect the starting dollar amount to the ending dollar amount?" That makes it much easier to compare different investments, time periods, or managers using the same yardstick.
Mental Math: The Rule of 72
While the exact CAGR formula requires a calculator, industry veterans often rely on a mental shortcut called the Rule of 72 to quickly understand what a growth rate actually means for their wealth. If you know the CAGR, you can instantly estimate how many years it will take for your money to double.
- Simply divide the number 72 by your expected CAGR.
- If an index fund has a historical CAGR of 8%, it will take about 9 years for your investment to double (72 ÷ 8 = 9).
- If a conservative bond yields a 4% CAGR, it will take 18 years to double your purchasing power (72 ÷ 4 = 18).
For a deeper dive into how this shortcut works across different scenarios, read our dedicated Rule of 72 guide.
CAGR vs. Simple Averages: Why Volatility Matters
A common mistake is to look at a list of yearly returns, average them, and assume that tells you how your account did. Unfortunately, averages can hide damage. Here's a simple two-year example:
- Start with $10,000.
- Year 1: the investment gains +30% → you now have $13,000.
- Year 2: it loses -30% on $13,000 → you end with $9,100.
If you simply average the yearly returns, you get: (+30% - 30%) / 2 = 0%. On paper that sounds like "no harm done." But your $10,000 fell to $9,100 — a real loss. The average return number missed what happened to your dollars.
CAGR forces us to respect the actual start and end values. In this case, it reports about a -4.6% loss per year over the two-year period. That may feel worse, but it is the truth — and it is far more useful when you are comparing this investment to alternatives.
A Quick Real-Life Example: Sarah's 10-Year Nest Egg
To see how this works outside of textbook examples, imagine a real investor named Sarah. Sarah tucked away $10,000 into a fund. For nine years, the stock market went on a wild rollercoaster ride—booming, dropping, and keeping her on the edge of her seat. On the 10th year, she logged in and saw her balance was exactly $20,000.
Her total return is a clean 100% (she doubled her money). But if Sarah wants to know how hard her money was working for her each year to hit that milestone, she uses CAGR. The math untangles those ten bumpy years and gives her a steady rate of 7.18% per year. Now, Sarah can easily compare her fund's true speed against a high-yield savings account or a corporate bond to see if the bumpy ride was actually worth it.
Adjusting CAGR for Inflation: Real vs. Nominal Returns
CAGR on its own only tells you how the number of dollars changed. It does not tell you what those dollars can buy. If prices climbed at the same time (inflation), the true improvement in your lifestyle can be much smaller than the headline growth rate.
To adjust for this, investors often talk about nominal vs. real returns. Nominal CAGR is the raw growth rate of your account balance. Real CAGR is the growth rate of yourpurchasing power after subtracting inflation. A common shortcut is to combine nominal CAGR and average inflation using the standard Fisher relationship:
where is the inflation rate. If your portfolio's nominal CAGR is 8% but inflation averaged 3%, your real CAGR is closer to:
Visualizing the Real-World Drag on Your Wealth
Swipe horizontally or scroll to the right to view the full screenshot.
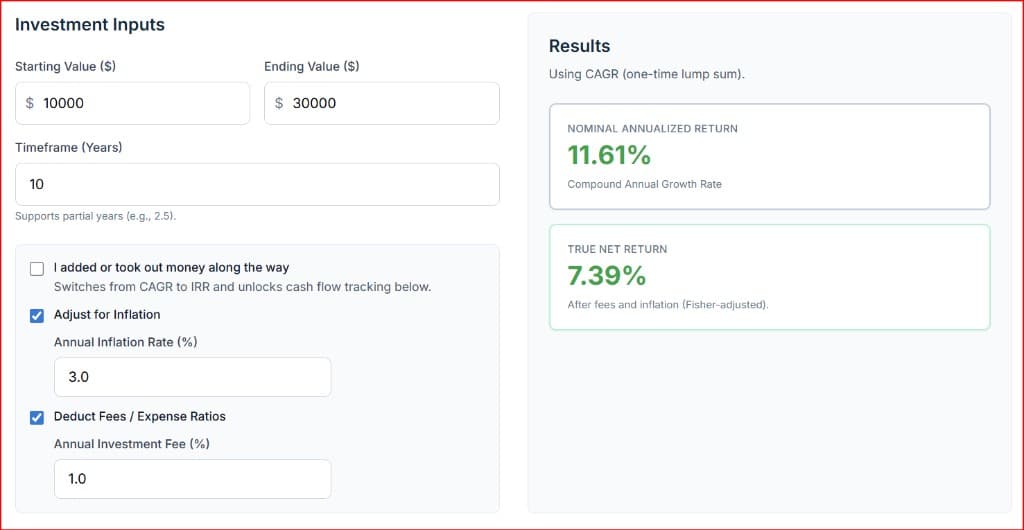
That roughly 4.85% is the growth rate that actually matters for goals like retirement income, tuition planning, or any target that depends on what your money can buy in the future — not just how big the account statement looks.
When CAGR Is Not Enough
CAGR is a great summary number, but it also has blind spots. It does not show you how bumpy the ride was, how deep the temporary losses were, or how you felt watching the account move up and down. A portfolio that repeatedly falls 40% and then rockets back up can end up with the same CAGR as one that climbs quietly with small, steady gains.
CAGR also assumes you invested one lump sum at the beginning and left it alone. Real life is messier: monthly contributions, occasional withdrawals, bonuses, and rebalancing trades. For those situations, measures like internal rate of return (IRR) or money-weighted returns are often better suited because they account for the timing of each cash flow.
A practical approach is to treat CAGR as the headline number for long-term growth, then pair it with a few supporting views: how big the worst drawdown was, how often the account went negative, and how your real (after-inflation) CAGR compares to a simple index fund benchmark.
The Short-Term Trap: Avoid the "30-Day Mirage"
Because CAGR stands for Compound Annual Growth Rate, it is built to measure long timelines—usually three to five years or more. A major trap regular folks fall into is trying to apply CAGR math to a hot stock or crypto asset they bought just a few weeks ago.
If you buy an asset for $100 and it jumps to $110 in just two weeks, you made a fast 10%. But if you plug a two-week timeline into an annualizing calculator, the formula treats your money like a rocket ship that will keep accelerating at that exact same speed for all 52 weeks of the year. It will spit out a wild CAGR of over 1,000%.
Unless you possess a crystal ball guaranteeing that asset will never take a single day off, annualizing short-term spikes creates a performance mirage. For quick, short-term flips, ignore CAGR entirely and look strictly at your simple total return.
What Is a "Good" CAGR? (Real-World Benchmarks)
Once you run your numbers, the very next question you will naturally ask is: "Is my percentage actually good?" While a good return depends entirely on your personal goals and risk tolerance, it helps to look at a few historical baselines to see how your money stacks up:
9% to 10% (The Stock Market Speed)
Historically, over very long multi-decade windows, a broad US stock market index fund (like the S&P 500) has grown at a nominal CAGR right around this neighborhood before adjusting for inflation. This is considered the benchmark standard for long-term equity growth.
4% to 5% (The Moderate Lane)
This pace is typical for conservative portfolios heavy in high-quality bonds, real estate funds, or modern high-yield cash accounts. Your money grows slower, but the path is significantly less scary.
2% to 3% (The Baseline Threat)
This is the historical speed of average annual inflation. If your personal investment CAGR sits in this zone, your account statement numbers are getting bigger, but your real-world purchasing power is standing completely still.
Putting CAGR to Work with Tools
You do not need to compute CAGR by hand every time. Once you understand what it represents, you can lean on calculators to do the heavy lifting and focus on the decisions:
- Use the True Annualized Return Calculator to instantly find your personal compound growth rate and see exactly how inflation and fees impact your take-home returns.
- Use the Compound Interest Calculator to see how different assumed CAGRs translate into future dollar amounts over specific timeframes.
- Use the Percentage Change Calculator to quickly compute percentage changes before you plug beginning and ending values into the CAGR formula.
- Use the ROI Calculator when evaluating one-off projects or business investments, then compare those results to your target CAGR or index benchmark.
When you combine these tools with a clear, plain-English understanding of CAGR, you move away from guesswork and toward deliberate, numbers-backed decisions about where each dollar goes.
| Measure | What it answers | Where it steers you wrong |
|---|---|---|
| CAGR | The steady yearly speed your money grew to get from start to finish. | It treats the journey like a perfectly smooth ride, completely hiding wild market drops or extra deposits along the way. |
| Simple Average of Yearly Returns | What you get if you just add up each year's return and divide by the total number of years. | Big losses wreck your compounding power. Gaining 50% and then losing 50% leaves you with less money, but a simple average falsely makes it look like you broke completely even. |
| Simple Total Return (No Annualization) | Your total raw growth percentage from start to finish, completely ignoring time. | It ignores the clock. Making 100% in 2 years is incredible; making 100% over 20 years is slow. Without annualizing, you cannot compare different timelines fairly. |
Definitive Summary
- What CAGR tells you: The single steady yearly growth rate that would take your money from its starting value to its ending value over a set number of years.
- Why averages mislead: Simple averages of yearly returns can hide real losses; CAGR always reconciles the actual beginning and ending dollar amounts.
- Real vs. nominal: Adjusting CAGR for inflation turns "growth in dollars" into "growth in what your money can buy."
- Limits of CAGR: It ignores volatility and cash-flow timing, so pair it with drawdown and risk views for a complete picture.
- How to use it: Treat CAGR as your headline score, then use calculators and supporting metrics to decide whether an investment truly meets your long-term goals.