What is NAV? The Math Behind Your Investments
An objective look at Net Asset Value, how it dictates fund pricing, and why it matters for evaluating your portfolio.
Published on

When evaluating investments, it is helpful to understand the distinction between a fund's market price and its underlying mathematical value. If a ticker symbol is trading at $45 a share, that number represents what buyers are currently willing to pay on the open market—but it does not necessarily represent the exact, base value of the assets the fund actually holds.
For individual, operational companies (like Apple or Microsoft), a stock's price is often driven by expectations of future growth and cash flows. However, when you step into the world of pooled investments—such as Mutual Funds, Exchange-Traded Funds (ETFs), Real Estate Investment Trusts (REITs), and Business Development Companies (BDCs)—the valuation is heavily grounded in clear arithmetic.
That foundational arithmetic is called Net Asset Value (NAV). Understanding NAV is a core step in making informed, objective investment decisions.
What Exactly is NAV?
In its simplest form, NAV is the "book value" of a single share of a fund. It represents the total value of everything the fund owns (its assets), minus everything the fund owes (its liabilities), divided by the number of shares currently sitting in investor accounts.
Think of it like liquidating an estate: If a fund were to sell every single stock, bond, or property it held today, pay off all its debts and management fees, and distribute the remaining cash to its shareholders, the exact amount each share would receive is the NAV.
NAV vs. Book Value: What About Regular Stocks?
If you look at the formula for NAV, you might ask: "Doesn't a company like Apple or Home Depot have assets, liabilities, and shares? Why don't we calculate NAV for them?"
We actually do, but in the world of regular operational companies, that exact same math (Assets minus Liabilities) is called Book Value. We treat Book Value and NAV very differently because of what the assets are.
A mutual fund's assets are highly liquid—they are literally just other stocks and bonds that can be sold on the open market in seconds. Therefore, the fund's NAV is a highly accurate representation of its immediate worth.
An operational company's true value, however, is heavily tied to intangible assets—things like software ecosystems, brand loyalty, patents, and future earning potential. Because you cannot easily liquidate "brand loyalty," regular stocks almost always trade at massive multiples far above their raw, mathematical Tangible Book Value.
It is also common to see stocks trading below their Book Value. This doesn't necessarily indicate a company is in distress; rather, it often reflects a "valuation gap." This can happen when a company owns specialized assets that are difficult to liquidate, belongs to an industry currently out of favor with investors, or is generating lower returns on its assets than the market currently demands. In these instances, the market is choosing to price the stock based on its active earnings potential rather than the theoretical value of its balance sheet.
A Key Dynamic: Premiums and Discounts
A fascinating aspect of the stock market is that a fund's NAV and its actual trading price rarely match perfectly. Just because a fund has a NAV of $20 doesn't mean you can buy it for exactly $20.
Depending on market sentiment, the liquidity of the underlying assets, and investor confidence in the management team, funds frequently trade at a Premium (you pay more than the underlying assets are currently worth) or a Discount (you pay less than the underlying assets are currently worth).
To model how purchasing at a premium or discount affects your long-term total return, you can run the variance through our ROI Calculator.
Let's look at how this math plays out practically across three distinct asset classes.
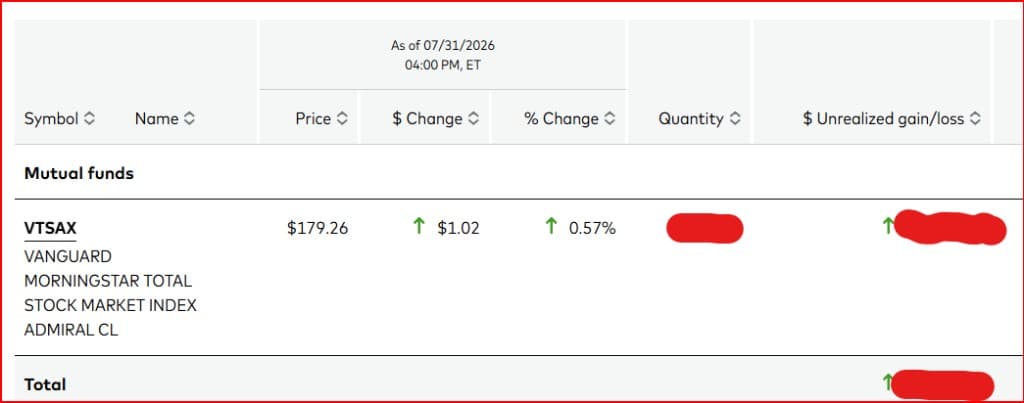
Example 1: The Standard Mutual Fund (The 4:00 PM Rule)
Standard mutual funds operate on strict daily accounting. They do not trade dynamically on the open market throughout the day like standard stocks do.
The Scenario: You place an order to buy an S&P 500 mutual fund at 11:00 AM.
The Math: The exact purchase price is not locked in at 11:00 AM. Instead, the fund waits until the closing bell at 4:00 PM EST. Accountants tally up the closing prices of all underlying stocks, subtract the daily accrued liabilities, and divide by the total shares.
The Result: If the math equals $150.25, your order executes at exactly $150.25. While standard mutual funds trade at their NAV, it is important to note that the actual proceeds an investor receives may be impacted by fund-specific sales loads or redemption fees. The "price" is the NAV, but the "net result" depends on the fund's specific fee structure.
Swipe horizontally or scroll to the right to view the full screenshot.
Example 2: The High-Yield BDC (Trading at a Premium)
Business Development Companies (BDCs) trade like regular stocks, which introduces supply and demand to their pricing. BDCs provide debt and equity to private, middle-market companies.
The Scenario: A highly regarded BDC holds loan assets mathematically worth $20.00 per share (Its NAV). However, the market ticker is currently trading at $24.00.
The Math: The fund is trading at a 20% Premium to NAV.
The Result: Why would investors willingly pay $24 for $20 worth of assets? Often, it is because that specific management team has a proven track record of generating reliable monthly dividends. Investors are willing to pay a premium for that steady cash flow. You can evaluate if that premium is justified for your goals by modeling the dividend reinvestment in a Compound Interest Calculator.
Example 3: The Hospitality REIT (Trading at a Discount)
Real Estate Investment Trusts (REITs) own physical buildings. Let's look at a hospitality REIT that owns 200 hotels.
The Scenario: The accountants appraise the hotel properties. After subtracting the mortgages, the NAV is calculated at $18.00 per share. But the stock is trading on the open market at $15.30.
The Math: The fund is trading at a 15% Discount to NAV.
The Result: Why the discount? The market might anticipate a temporary economic slowdown, leading investors to believe business travel will decline. Therefore, the market prices the shares lower than the current physical appraisals. Some value investors actively look for these discounts, viewing it as an opportunity to buy real estate at a lower entry point. In the REIT world, a persistent discount to NAV often suggests that the public market believes the "private market value" of the physical buildings is lower than what the fund's internal appraisers are claiming.
| Key Metric | What it Actually Means | Simple Definition |
|---|---|---|
| Net Asset Value (NAV) | The Inside Value | The exact mathematical value of a single share, based entirely on the underlying investments held inside the fund. |
| Market price | The Price Tag | The live price you pay to buy or sell a share on the stock exchange. This moves based entirely on public buying and selling demand. |
| Premium or discount | The Price-to-Value Gap | The percentage gap between the market price tag and the fund's true inside value. Gaps happen when investors get overly excited about a fund or panic about future drops. |
The Invisible Anchor: Why ETFs Stay Glued to NAV
If Exchange-Traded Funds (ETFs) trade live on the stock exchange all day long just like regular stocks, you might wonder why their prices don't get driven up by irrational hype or crashed by sudden panic. Why do they stay so perfectly lined up with the actual value of what they own?
The secret isn't that ETF investors are magically disciplined. It's because of a behind-the-scenes balancing act run by large financial companies. Think of it as a continuous, automated price-match guarantee.
To see exactly how this works, imagine a hypothetical "Gold Star ETF" that owns a massive pool of popular tech stocks. Let's say the total market value of all the combined shares sitting inside the ETF's vault is exactly $100 million. If the ETF has issued exactly 1 million investor shares floating around on the stock market, then each individual share represents a precise slice of that vault worth exactly $100.00. That $100.00 is the true Net Asset Value (NAV).
But what happens if a sudden wave of retail investor hype breaks out? Enthusiastic buyers scramble to buy the ETF on the open stock exchange, driving up demand and bidding the ETF's trading price up to $100.10, even though the assets inside the vault haven't changed.
While a 10-cent premium seems tiny, it creates an immediate opportunity for large financial trading firms. Sensing an automatic profit, a firm will look at the ETF's "vault recipe." They go out onto the open stock market and buy up the exact matching bundle of underlying tech stocks required to build a brand-new slice of the vault for exactly $100.00. They hand those raw stocks directly to the ETF company, which accepts the assets and hands the firm a brand-new, freshly minted ETF share in return.
Finally, the firm turns around and dumps that new ETF share onto the stock exchange, selling it to the hyped-up buyers for $100.10 and safely pocketing a free 10-cent profit per share.
Because these firms repeat this loop with blocks of tens of thousands of shares in a fraction of a second, the sudden, massive flood of new ETF supply completely overwhelms the retail buying hype. This intense selling pressure instantly drags the market trading price back down from $100.10 to $100.00, keeping it perfectly glued to the real mathematical value of the vault. If the price ever drops too low, the process runs in reverse. This continuous, hidden gravity is the exact reason your favorite index funds track their true asset value with near-flawless precision.
Definitive Summary
- The Definition: NAV is the raw mathematical value of a fund's underlying assets minus its liabilities, calculated on a per-share basis.
- Mutual Funds: Settle exactly at NAV once per day. You receive exactly what the assets are worth at the closing bell.
- ETFs, BDCs, and REITs: Trade dynamically throughout the day. They frequently trade at a Premium (driven by high demand or steady dividends) or a Discount (driven by lower market outlooks).
- NAV vs. Book Value: While NAV for funds represents the current appraised value of the underlying holdings, "Book Value" for regular stocks is more complex. Stocks often trade at a multiple of their book value due to intangible assets (like brand power), but can also trade at a discount if the market believes those assets are difficult to sell or are underperforming.
- The ETF Price Anchor: Even though ETFs trade live all day, hidden automated systems run by large financial firms instantly erase any price gaps. This acts like a continuous price-match guarantee, keeping the trading price perfectly glued to its true NAV.
- The Takeaway: Checking a fund's premium or discount to its NAV is a helpful habit. Knowing the mathematical value of the underlying assets provides a solid foundation for evaluating your investments.