"1.5% a Month" Is Not 18% a Year
Multiplying a monthly rate by 12 understates the true annual cost—here's the simple fix.
Published on

A store credit offer says 1.5% a month. Your brain does the quick math: 1.5 × 12 = 18% a year. That shortcut feels clean. It is also wrong—in a way that quietly understates what you actually pay.
Interest that compounds monthly earns (or charges) interest on interest. Multiplying by 12 pretends each month starts fresh, as if prior interest never stuck around. The true one-year cost is higher than 18%. How much higher? About 19.56% for that 1.5% monthly quote.
This post is the layperson fix: spot the trap, run one short formula, and compare offers on the same annual basis. When you want the deeper vocabulary of “stated label vs. true annual math,” pair this with Nominal vs. Effective Interest Rate.
The trap in one picture
Same monthly quote. Two annual answers. Only one matches how compounding actually works.
Swipe sideways if the diagram is cropped on a small screen.
Why ×12 understates the cost
Multiplying by 12 treats each month as if interest never sticks to the balance. In real products—credit cards, many revolving lines, and a lot of store financing—unpaid interest usually becomes part of next month's starting point.
Think of a snowball rolled down a hill twelve times. Each pass picks up a little more snow. ×12 counts twelve separate tiny snowballs. Compounding counts one growing snowball.
A $1,000 balance, month by month
Start with $1,000 at 1.5% per month, and leave the interest unpaid so it compounds:
- After month 1: $1,000 × 1.015 = $1,015.00
- After month 2: $1,015 × 1.015 ≈ $1,030.23
- After 12 months: $1,000 × (1.015)¹² ≈ $1,195.62
You owed about $195.62 in interest over the year. That is a 19.56% annual cost—not 18%. The missing ~1.56 percentage points is interest charged on earlier interest.
Want to stress-test growth or debt with your own numbers? Use the Compound Interest Calculator.
The running-tab analogy (why your brain loves ×12)
Picture a restaurant that never closes your check. Every month you still owe the prior balance, and the house adds a 1.5% tip on whatever the tab says right now—not on the original entrée alone.
The ×12 shortcut imagines twelve separate dinners: tip $1.50 on a fresh $100 meal twelve times, put the tip jars in a row, and count $18 total. Neat. Wrong for a running tab.
On a real running tab, month two's tip is 1.5% of $101.50, month three is 1.5% of that new total, and so on. By year-end the tips add up to about $19.56 on that same $100 start—the extra comes from tipping on earlier tips.
Your brain likes ×12 because it treats money like twelve closed checks. Lenders often treat unpaid balances like one open check that never gets wiped. That mismatch is the whole trap.
Swipe sideways if the diagram is cropped on a small screen.
When does the “closed check” story actually fit?
Sometimes ×12 is close enough that the drama shrinks:
- You pay the balance in full every month (true closed checks)—revolving interest never gets a chance to stack.
- The product is simple interest by contract (interest is not added into the base for the next period). Always read the fine print; do not assume.
- The monthly rate is tiny—at 1% the EAR gap is under a percentage point. At 2.5%–3% the gap becomes loud.
Rule of thumb: if unpaid interest can ride into next month's starting balance, treat the quote like a running tab and convert to EAR before you brag about “only 18%.”
The one formula that fixes it
If i is the monthly decimal rate (1.5% = 0.015), the effective annual rate is:
EAR = (1 + i)¹² − 1
Plug in 0.015: (1.015)¹² − 1 ≈ 0.1956 → 19.56% per year.
That EAR is the apples-to-apples annual number. The ×12 result is a convenient label that understates compounding. For the broader map of “stated annual label” versus “true one-year economics,” see nominal vs. effective rates—this article is the monthly special case of that same idea.
Swipe sideways if the diagram is cropped on a small screen.
Quick lookup: monthly quote → ×12 vs. true EAR
Use this table when an offer is quoted monthly. The middle column is the tempting shortcut. The right column is what one full year of compounding actually does.
| Monthly rate | ×12 shortcut | Effective annual (EAR) | Gap |
|---|---|---|---|
| 1.0% | 12.00% | 12.68% | +0.68 pp |
| 1.5% | 18.00% | 19.56% | +1.56 pp |
| 2.0% | 24.00% | 26.82% | +2.82 pp |
| 2.5% | 30.00% | 34.49% | +4.49 pp |
| 3.0% | 36.00% | 42.58% | +6.58 pp |
Notice the pattern: the higher the monthly rate, the more ×12 lies. At 1% the gap is under a point. At 3% the gap is more than six points. That is why the trap hurts most on expensive revolving credit.
In dollars: on a $5,000 balance at 1.5% a month, the ×12 story implies about $900 of interest in a year if nothing were paid. Compounding implies closer to $978. That ~$78 gap is the “tip on the tip” your shortcut erased—small next to a mortgage, loud next to a store card you meant to clear “soon.”
Where you meet this quote in real life
Store cards and “easy monthly” financing
Ads love monthly numbers because they look small. Convert to EAR before you compare that offer to a bank card APR or a personal loan. Then check whether the payment plan is amortizing (principal drops each month) or revolving (balances can linger). For how payment schedules split interest vs. principal, see What Is Amortization in Mortgage and Auto Loans?.
Credit cards that talk in monthly pieces
Some disclosures emphasize a periodic rate. Your job is the same: convert to a true annual figure before ranking products. If you are weighing a 0% transfer window against carrying a balance, the 0% APR Payoff Planner and our balance transfer math guide help with the cash-flow side once rates are on equal footing.
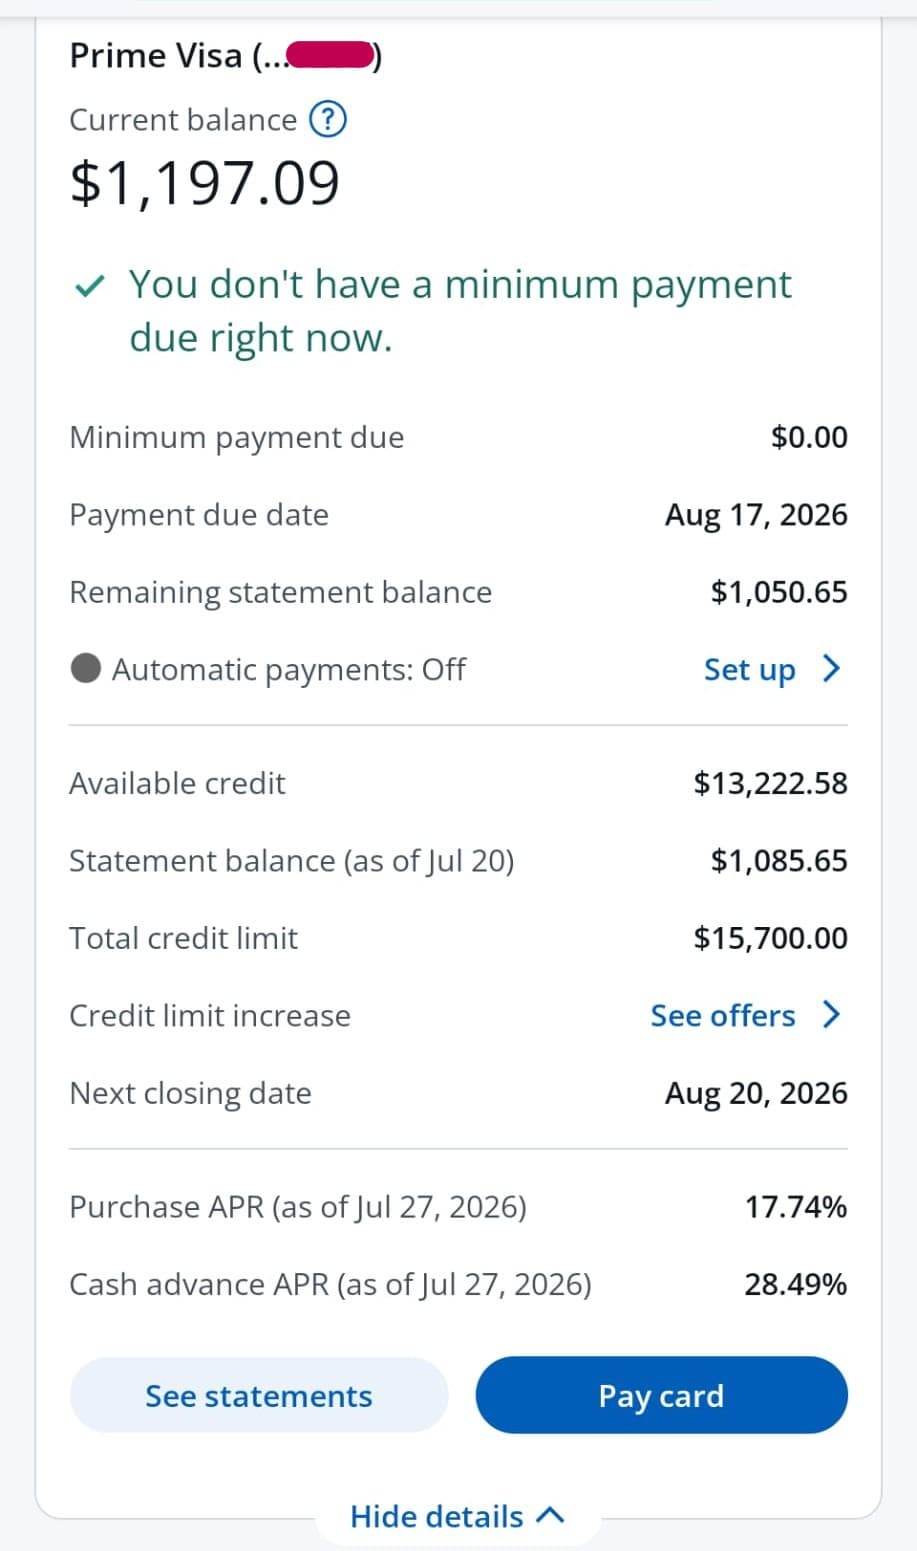
Real-World Disclosures: Reading Your Card's True APR
Swipe horizontally or scroll to the right to view the full screenshot.
Savings quotes (the trap flips direction)
The same math helps you when compounding works for you. A monthly yield quote ×12 understates what a year of compounding can earn. Still convert—then compare deposits on effective annual yield, not headline shortcuts. For long-horizon doubling intuition after you have a true annual rate, the Rule of 72 is a handy mental check—not a replacement for EAR.
“But the payment looks affordable…”
Monthly quotes sell comfort. EAR sells honesty. A payment that fits January can still leave you with a tab that grew in the background if you only covered part of the interest. Convert the rate first; then pressure-test the payment against take-home pay and other debts—not the other way around.
A 60-second comparison workflow
- Write down the monthly percent as a decimal (1.5% → 0.015).
- Compute EAR = (1 + i)¹² − 1 (or use the table above for common rates).
- Compare that EAR to other products' true annual figures—not to someone else's ×12 shortcut.
- Translate the winner into monthly cash pressure with the Debt-to-Income Calculator and your real take-home from the Paycheck Calculator.
Rate math chooses the cheaper product on paper. Cash-flow math checks whether your month can survive it.
Summary: stop multiplying by 12
- Think running restaurant tab, not twelve closed checks: ×12 counts separate tips; EAR counts tips on a growing total.
- 1.5% a month × 12 = 18% is a shortcut that ignores compounding.
- The true one-year cost is EAR = (1 + monthly rate)¹² − 1—about 19.56% for 1.5% monthly.
- Gaps grow as monthly rates rise; expensive revolving credit hides the biggest understatements.
- Convert every monthly quote to EAR before ranking offers, then check monthly payment reality with DTI and paycheck tools.
- For the full nominal-vs-effective vocabulary behind this trap, read Nominal vs. Effective Interest Rate.