The Currency Conversion Gap: Mid-Market Rate vs. What You Actually Paid
Your converter shows the fair interbank benchmark. Your receipt shows what you were charged. Here's the math to measure the difference—and tell markup from fees.
Published on

Imagine buying a jacket with a clear tag price of $100—then the cashier charges $108 and shrugs. That extra $8 is not mysterious. It is a gap between the “fair” price and the price that hit your wallet.
Currency conversion works the same way. A mid-market exchange rate (the fair benchmark banks use with each other) is the jacket tag. Your bank app, airport kiosk, or card receipt is the cashier. The difference—the currency conversion gap—is what this guide teaches you to measure in dollars and percent, then break into pieces so you know what you paid for.
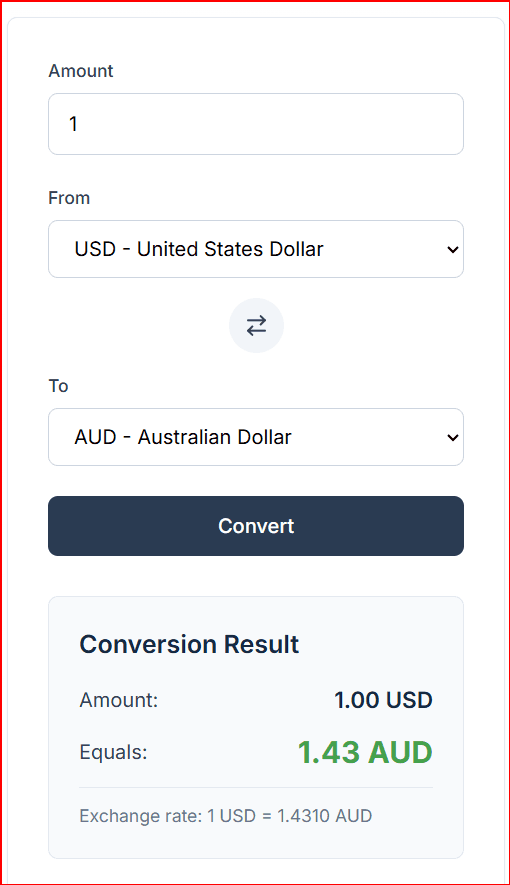
Use our Currency Converter for the fair benchmark (European Central Bank–style mid-market data via Frankfurter). Then bring your real receipt. This post is the worksheet between those two numbers—not a repeat of “avoid airport kiosks” tips you have heard a hundred times.
Sneak Peek: Find Your Fair Mid-Market Benchmark
Swipe horizontally or scroll to the right to view the full screenshot.
What “mid-market” actually means (and why we use it)
Currencies are like any other market: someone is always willing to buy a little cheaper, and someone is always willing to sell a little higher. Those two quotes are the bid and the ask. The mid-market rate (also called the interbank rate) sits in the middle—the simple average of those two sides.
That midpoint is the jacket tag. It is not a special deal for tourists, and it is not “the secret bank price.” It is the public fair reference traders use when they talk about what a currency is worth before a retail desk, kiosk, or card product adds its own markup.
Why start here? Because you need one shared yardstick. Your bank’s sell rate, an airport board, and a card statement each invent their own cashier price. Mid-market is the one number you and a stranger on the internet can both look up and agree was “fair” that day. Our Currency Converter shows that jacket-tag rate (European Central Bank–style mid-market data via Frankfurter)—so when your receipt is higher, the difference is the gap this post teaches you to measure.
One honest limit: this benchmark updates on a published schedule, not every millisecond of a trading screen. Treat it as a fairness sticker for your audit, not a promise that your card statement will match it to the penny.
Three prices for the same pile of money
With mid-market as the jacket tag, name the other prices that get mixed up in everyday talk:
- Mid-market rate (the jacket tag): the fair midpoint we just defined—the sticker before retail markup. Our converter shows this kind of rate.
- Card-network settlement rate: the rate your credit or debit card network often uses when it settles a foreign charge. It is usually closer to mid-market than an airport kiosk, but it is not guaranteed to match the converter tick-for-tick.
- Customer rate: whatever you were actually charged—bank sell rate, kiosk board, or the home-currency total on your statement. That is the cashier’s number.
Most “hidden fee” frustration lives between the jacket tag (#1) and the cashier (#3). Your job is not to memorize jargon. Your job is to put both numbers on the same receipt and subtract.
Swipe sideways if the diagram is cropped on a small screen.
The Conversion Gap formula (the whole point of this post)
You only need two ingredients:
- Mid-market cost — what the converter says the foreign amount should cost in your home currency.
- Paid cost — what actually left your account (or the home-currency total on the receipt).
Then:
- Gap in dollars = Paid cost − Mid-market cost
- Gap in percent = (Paid cost ÷ Mid-market cost − 1) × 100
Using the jacket example: ($115 − $108) = $7. And ($115 ÷ $108 − 1) × 100 ≈ 6.5%. That 6.5% is the all-in “tax” on that conversion—before you even ask whether it was a sneaky rate, a flat fee, or both. If you want a refresher on why that percent formula is “new ÷ old − 1” (and when people mix it up with other percent math), see our real-world guide to percent change.
Optional: gap from the unit rates
If your statement shows an exchange rate (how many home dollars per one euro, for example) instead of a clear total:
- Gap % ≈ (Your rate ÷ Mid-market rate − 1) × 100
- Gap $ ≈ Mid-market cost × (Gap % ÷ 100)
Same story, different label on the receipt. If the math feels upside-down (you got more foreign currency than mid-market predicts), your gap can be negative—you beat the benchmark that day. Rare at kiosks; more plausible with a competitive card and clean local-currency charging.
Swipe sideways if the diagram is cropped on a small screen.
Unbundle the gap: four common pieces
A $7 gap is a total. It can be made of different ingredients—like a grocery receipt that mixes milk, tax, and a bag fee. Naming the pieces stops you from fixing the wrong problem next time.
1. Rate markup (spread baked into the rate)
The provider simply gives you a worse rate than mid-market. No separate “fee” line. The cost hides inside the exchange rate itself. Classic bank / kiosk pattern.
2. Foreign transaction fee (FTF)
FTF means foreign transaction fee: an extra percent (often about 1%–3%) some cards add on top of foreign purchases. It may appear as its own line. A card that advertises “no foreign transaction fees” removes this piece—but it does not magically erase rate markup if a merchant or bank still worsens the rate.
3. Flat fee
A fixed dollar (or euro) charge for a wire, transfer, or window visit—$15, $25, $45—regardless of a small or large conversion. Flat fees hurt small amounts the most (a $25 fee on a $100 conversion is a 25% hit before rate markup).
4. DCC — Dynamic Currency Conversion
DCC means dynamic currency conversion: the merchant’s terminal offers to charge you in your home currency (USD) instead of the local currency (EUR). It feels convenient. Math-wise, it often locks in a padded rate controlled by the merchant’s provider. If the terminal asks “charge in USD or EUR?” and you are physically abroad, choosing local currency (EUR) is usually how you keep the conversion on your card network’s terms instead of the terminal’s.
Swipe sideways if the diagram is cropped on a small screen.
Worked example: one €100 purchase, four outcomes
Suppose mid-market says €100 costs $108.00 today (illustrative numbers—always pull a live figure from the converter). Here is how different real-world paths can widen the gap.
| How you paid | What hit your wallet | Gap $ | Gap % | Likely pieces |
|---|---|---|---|---|
| Clean card, local currency, no FTF | $108.80 | $0.80 | ~0.7% | Tiny settlement difference |
| Card with 3% FTF, local currency | $111.24 | $3.24 | ~3.0% | Mostly FTF |
| Terminal DCC “charge in USD” | $116.50 | $8.50 | ~7.9% | Mostly DCC markup |
| Airport cash desk | $118.00 | $10.00 | ~9.3% | Heavy rate markup (± flat fee) |
Notice the lesson is not “cards good, cash bad” as a slogan. It is: measure first, then see which bucket filled the gap. A no-FTF card plus accidental DCC can still lose to a careful local-currency charge.
Why the converter will not match your card statement exactly
Our tool uses publicly published mid-market-style rates refreshed on a central-bank schedule (not a live trading desk ticking every second). Your card network settles on its own timetable. Weekends and holidays can freeze published benchmarks while the world keeps moving.
So treat the converter as a fairness yardstick, not a courtroom exhibit that must equal the statement to the penny. A 0.5% difference can be noise. A 6%–10% difference is a story worth unbundling.
ECB, in plain English
ECB means European Central Bank. Many free converters (including the data behind ours) lean on that family of published rates. You are benchmarking against a transparent reference—not against a secret “true” price only banks know.
Two quick scenarios with the same worksheet
Travel: dinner abroad
Bill is €46. Converter says mid-market cost is $49.70. Statement shows $53.10 after you tapped “USD” on the terminal. Gap = $3.40 ≈ 6.8%. Primary suspect: DCC. Next time, choose local currency and rerun the audit.
Transfer: getting paid from overseas
Client sends €2,000. Mid-market says that is about $2,160. You receive $2,105 after “all-in” conversion. Gap = $55 ≈ 2.5%. Open the transfer receipt: was there a flat receiving fee, a rate markup, or both? The percent tells you how loud to care; the line items tell you what to change (provider, timing, or invoice currency).
For inflation’s long-run bite on purchasing power (a different problem than FX markup on one payment), see How Inflation Impacts Your Purchasing Power.
When the gap is “fine” vs. when it is a convenience tax
Math does not moralize. A 1% gap on a once-a-year souvenir may be cheaper than twenty minutes of terminal wrestling. An 8% gap on monthly freelance payouts is a recurring salary cut.
- One-off, small dollars, high hassle — a modest gap can be rational.
- Repeat transfers or large tickets — measure, then shop rails (card choice, local currency, transfer service) using the same gap % as your scoreboard.
- Anything with DCC prompts — pause; that prompt is often where convenience gets expensive.
This is educational math, not advice from a bank, broker, or licensed advisor. Your card terms and local laws still rule.
Summary: audit any conversion in five steps
- Convert the foreign amount in the Currency Converter → mid-market (fair) cost.
- Read what you actually paid from the receipt or statement.
- Compute Gap $ = Paid − Fair, and Gap % = (Paid ÷ Fair − 1) × 100.
- Unbundle: rate markup, FTF (foreign transaction fee), flat fee, and/or DCC (dynamic currency conversion).
- Decide if the gap is worth the convenience—or worth changing how you pay next time.
The converter shows the jacket tag. This worksheet shows what the cashier added. Once you can price that gap, travel tips stop being folklore and start being measurable.